Rhode Island and Massachusetts Eclipse Efficiency Targets
The final numbers are in, and the results are impressive. Final 2015 assessments indicate that both Massachusetts and Rhode Island surpassed their electric energy efficiency savings targets. Once again, these efficiency leaders push the perceived limits of efficiency programs—demonstrating that energy efficiency programs can achieve electricity savings above or near 3 percent of sales.
Some might hypothesize that, after years of aggressive efficiency programs, further increasing efficiency efforts might result in increasingly more expensive programs. But the numbers say just the opposite: Not only did both states exceed their electric savings targets, they did so at lower cost than expected. On a related note, both states also exceeded their gas savings targets at a lower cost per saved energy than planned.
Reaching the 3 Percent Mark
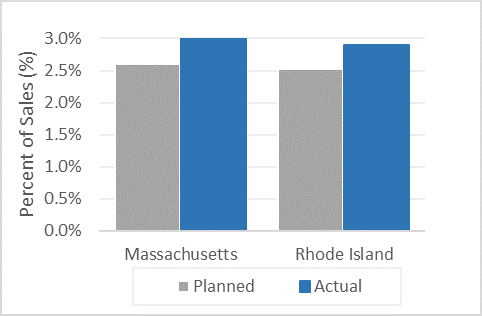
Massachusetts’ electric energy efficiency program administrators dramatically exceeded their programs’ lifetime savings goals (see Figure 1), and annual savings reached 3 percent of planned sales (Figure 2). To put that number in perspective, many states are barely achieving annual efficiency savings of 0.5 percent of electricity sales.
Rhode Island’s program administrator also surpassed stated goals by a large margin. Its programs’ lifetime electric savings exceeded expectations by 16 percent, and annual savings reached nearly 3 percent of planned sales.
Figure 1. Lifetime Savings
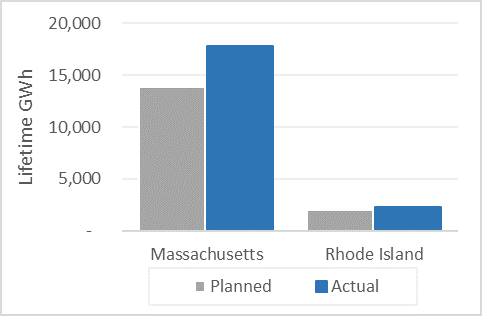
Figure 2. Annual Savings as Percent of Sales
A Great Deal for Customers
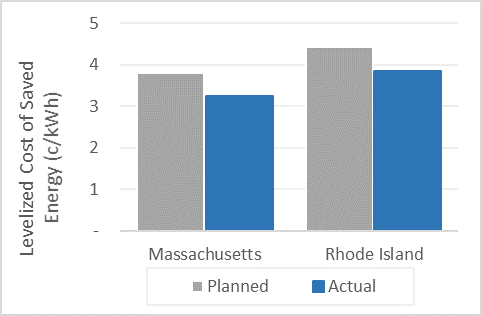
Massachusetts’ and Rhode Island’s electric energy efficiency success is great news for customers. Not only was energy efficiency less than the cost of other supply options, but the actual cost of saved energy was far lower than planned (Figure 3). In Rhode Island, the cost of saved energy was about 13 percent lower than planned, and in Massachusetts the cost of saved energy came in roughly 14 percent lower. The cost of the efficiency savings are well below the typical supply costs of roughly 8 cents per kWh.
Figure 3. Levelized Cost of Saved Energy (¢/kWh)
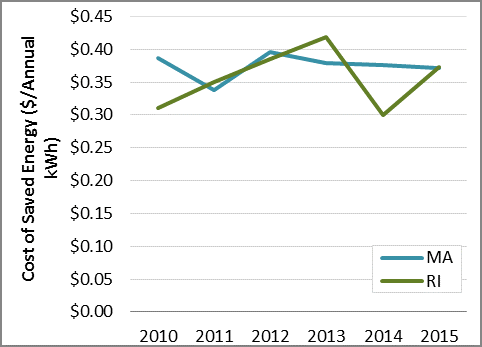
While these states do a stellar job implementing efficiency programs, they have yet to reach the ceiling. Energy efficiency savings in Massachusetts and Rhode Island have steadily increased since 2010, around the time the states began significantly ramping up energy efficiency efforts (Figure 4). These aggressive savings were achieved while costs were relatively level or decreasing (Figure 5: Rhode Island data for 2014 is anomalous given a large, one-of-a kind commercial and industrial project). The takeaway is clear: There’s still plenty of room for energy efficiency to cost-effectively meet energy needs and achieve state and national climate goals.
For those readers who might think that there is something different about the customers, the end-uses, or the electricity prices in Massachusetts and Rhode Island that make them unique – think again. The primary factor that leads to these results in these states is the regulatory climate. Both states benefit from supportive regulatory policies, including very active stakeholder participation, timely and predictable cost recovery, timely recovery of lost revenues through decoupling, well-designed utility shareholder incentives, and comprehensive, credible estimates of avoided costs.
Figure 4. Historical Annual Savings as a Percent of Sales
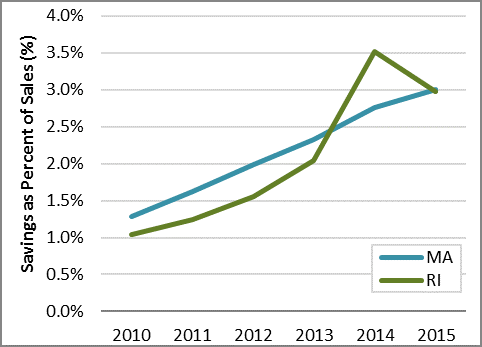
Figure 5. Historical Cost of Saved Energy