AEO 2016 Doubles Renewables but Falls Far Short of Long-Term Emissions Goals
On September 15, 2016, the Energy Information Administration (EIA) released the final results of the Annual Energy Outlook (AEO) 2016. AEO is a critical source of information for public interest stakeholders in the energy sector. Throughout the development of AEO 2016, Synapse has actively worked with the EIA in a stakeholder process, reviewing inputs, model improvements, and preliminary results.
The final AEO 2016 contains projections of energy use from the electric power, residential, commercial, industrial, and transportation sectors through 2040 (we wrote about the early release of AEO 2016 back in May). Also included in these projections are associated data on fuel prices, renewable capacity, and carbon dioxide (CO2) emissions. New to this year’s AEO is the inclusion of modeling of the Clean Power Plan, EPA’s upcoming regulation to reduce CO2 emissions by 32 percent by 2030.
Below is a summary of key highlights in the final version of AEO 2016:
Including the Clean Power Plan in AEO 2016 reduces electric-sector CO2 emissions by 6.4 billion metric tons through 2040
The major change from last year’s AEO 2015 to this year’s AEO 2016 Reference case is the incorporation of the CPP for the electric sector. As a result, 2040 CO2 emissions are reduced by over 400 million metric tons (21 percent) compared to a projection with no Clean Power Plan and by nearly 830 million metric tons (35 percent) compared to 2005 levels (see Figure 1). Over the entire study period, cumulative emission reductions total 6.4 billion metric tons. Even without the Clean Power Plan, electric-sector greenhouse gas emissions are reduced by 420 million tons by 2040 (a reduction of 18 percent compared to 2005 levels) because of increased natural gas and renewable generation.
Figure 1. Comparison of electric-sector CO2 emission projections through 2040 in the AEO 2016 Reference case (AEO2016 Ref) to the AEO 2015 Reference case (AEO2015) and the AEO 2016 case without the Clean Power plan (AEO2016 NoCPP) 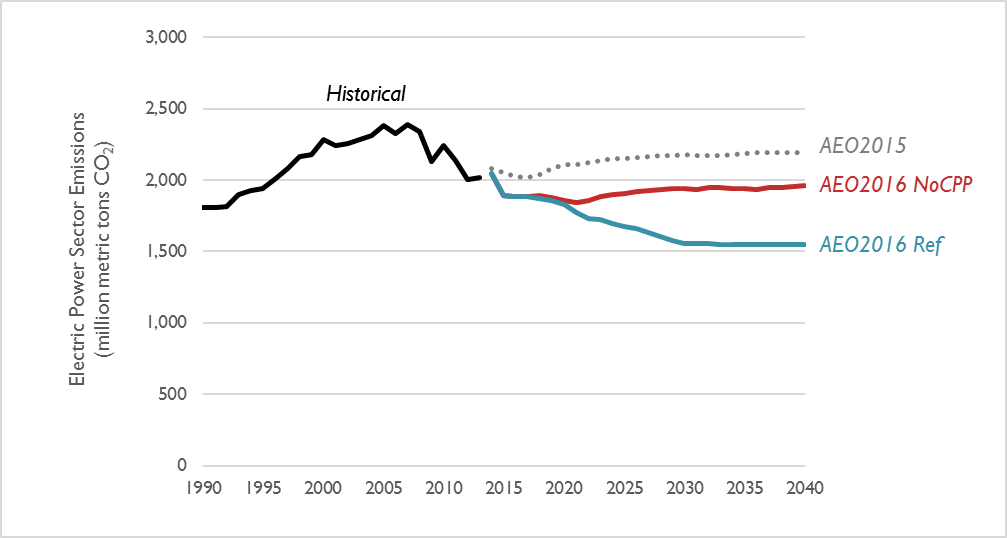
In addition to the version of the Clean Power Plan modeled in the AEO 2016 Reference case, which examines mass-based compliance over new and existing sources with limited regional trading and allowance revenues rebated to ratepayers, EIA also modeled a number of sensitivities. These sensitivities model different approaches to the Clean Power Plan including:
- Rate-based compliance
- Widened, interregional trading
- Clean Power Plan extension through 2040, with deeper reduction targets through 2040
- Hybrid state approaches to the Clean Power Plan (with a mix of rate- and mass-based compliance)
- Allowance revenue rebated to generators
Depending on the adjustment, 2040 CO2 emissions could be as high as 4 percent higher than the AEO 2016 Reference case or as low as 9 percent below the AEO 2016 Reference case.
The Clean Power Plan is achieved with only a 3 percent decrease in sales by 2040
Although energy efficiency can be used to displace generation and reduce emissions, the AEO 2016 Reference case models achieving Clean Power Plan compliance with only a 3 percent decrease in sales compared to the future with no Clean Power Plan (see Figure 2). Though the level of 2040 sales projected in the AEO 2016 Reference case is roughly equal to the level of sales projected in AEO 2015, projected sales are reduced for much of the study period. Between 2016 to 2040, sales increase at a rate of 0.74 percent per year in the Reference case—nearly five times the sales growth rate observed between 2006 and 2015.
Figure 2. Comparison of electricity sales projections through 2040 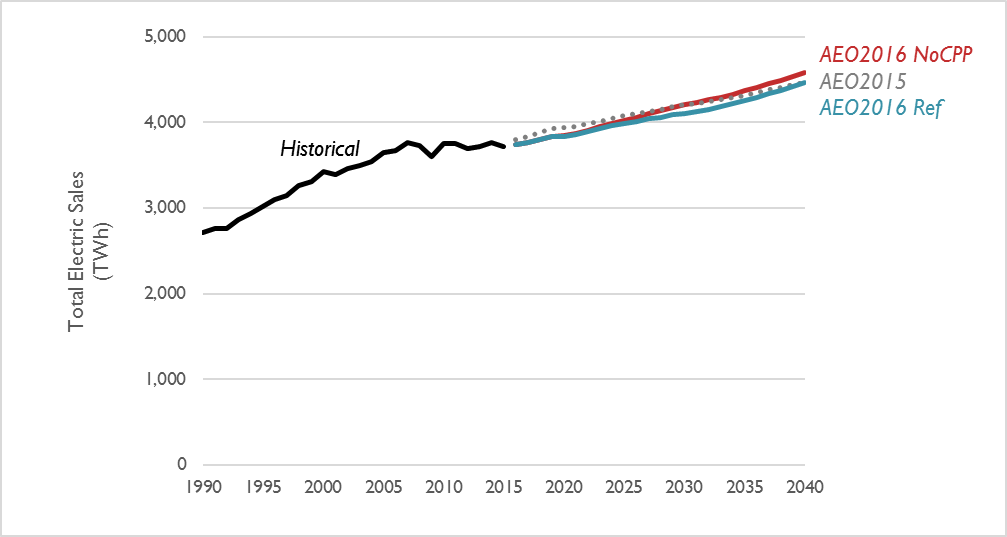
Increased generation from renewables and natural gas are key drivers of emission reductions
Renewables and natural gas each play a key role in producing the emission reductions observed in AEO 2016 compared to AEO 2015. By 2040, natural gas generation is projected to be 32 percent higher than in last year’s Reference case while renewable generation is projected to be 122 percent higher (see Figure 3).
Figure 3. Comparison of natural gas and renewable generation projections through 2040 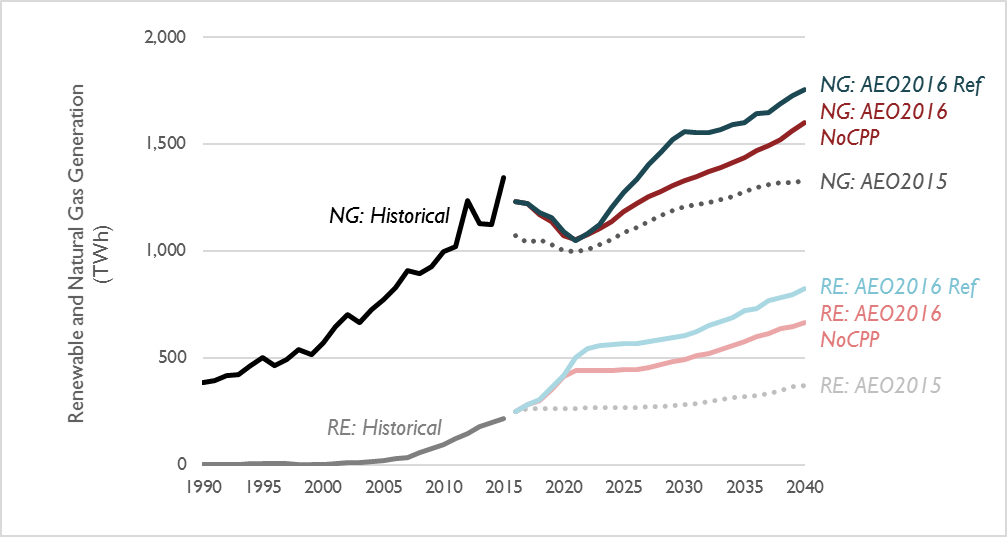
Notes: Generation from natural gas is indicated by the darker colors (NG). Generation from renewables is indicated by the lighter colors (RE). “Renewables” includes generation from wind, utility-scale photovoltaics and solar thermal, and distributed photovoltaics.
While the Clean Power Plan is a key driver of this increase in natural gas and renewable generation, EIA made significant downward revisions to both the projected cost of natural gas (as a fuel) and the projected capital cost of natural gas, wind, and solar generators in this year’s edition of the AEO. For example, from AEO 2015 to AEO 2016, EIA projects the near-term base overnight cost of building photovoltaics (i.e., capital costs before tax incentives) to have decreased by 24 percent (see Table 1). For on-shore wind, EIA has revised their cost projection down by 15 percent. The EIA has also included the extension of wind and solar tax incentives passed at the end of 2016, which represent a significant incentive for increased renewables additions prior to their phase out—2020 for the production tax credit and 2022 for the investment tax credit. At the same time, EIA’s projection for the cost of natural gas fuel has been reduced by 22 percent in the Reference case. As a result, even in a future with no Clean Power Plan, natural gas and renewables produce much more electricity generation in this year’s AEO than in last year’s projections.
Table 1. Near-term base overnight capital costs (2015 $/kW)
|
|
AEO 2015 |
AEO 2016 |
% Change |
|
Utility-scale photovoltaics |
$3,256 |
$2,480 |
-24% |
|
On-shore wind |
$1,929 |
$1,644 |
-15% |
|
Advanced natural gas combined cycle |
$1,060 |
$1,080 |
2% |
All-sector CO2 emissions show that further policies will be required to achieve the level of emission reductions necessary to avert catastrophic climate change
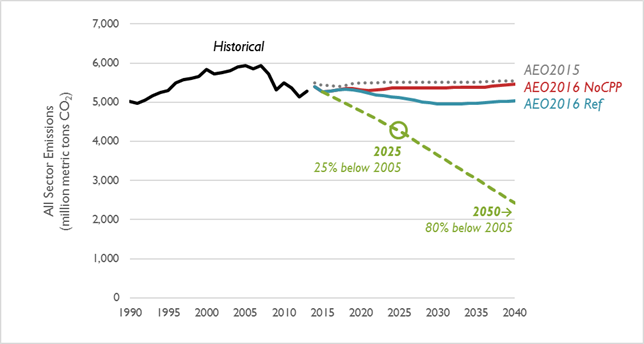
According to the 2015 U.S. Report to the United Nations Framework Convention on Climate Change, national CO2 emissions will need to reduce by 25 percent by the year 2025 and 80 percent by the year 2050 to avert catastrophic climate change. Even with the Clean Power Plan and revision to natural gas and renewable prices, the AEO 2016 Reference case projects essentially flat emissions compared to 1990 levels (see Figure 4). Synapse recommends that future editions of the AEO incorporate these long-term emission reduction goals in modeled scenarios.
Figure 4. Comparison of all-sector CO2 emission projections through 2040