AEO 2017 Projects Lower Levels of Natural Gas but Steady CO2 Emissions
On January 5, 2017, the Energy Information Administration (EIA) released the 2017 Annual Energy Outlook (AEO). The final AEO 2017 contains projections of energy use from the electric power, residential, commercial, industrial, and transportation sectors through 2050 for the first time in AEO’s history. Publishing a new release just four months after the final AEO 2016, EIA has changed the way it produces its annual projections. Rather than conducting a comprehensive review of all modeling inputs every single year, EIA is now on a two-year schedule, where each “off-year” contains only minor changes in input assumptions compared to the previous year.
Nonetheless, these minor changes have a significant impact in driving energy projections. While the AEO 2017 Reference case continues to model the Clean Power Plan as law, other changes to input assumptions have resulted in strikingly different projections, relative to AEO 2016. Here are some key highlights from AEO 2017:
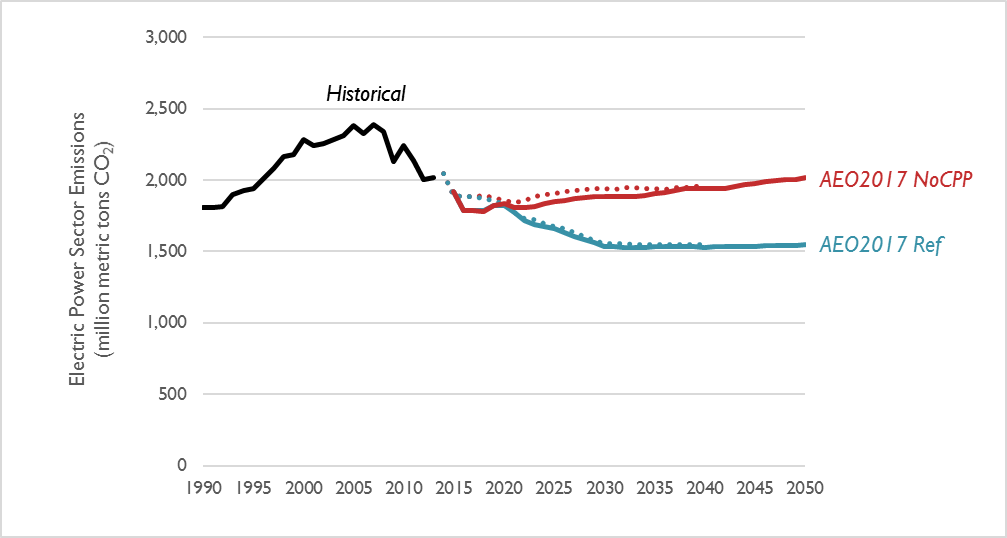
Electric-sector CO2 emissions remain relatively unchanged compared to AEO 2016
Electric sector carbon dioxide emissions are 2 percent lower in the latest AEO 2017 Reference case relative to the AEO 2016 Reference case, when looking at the entirety of CO2 emitted between 2017 and 2030 (Figure 1). However, AEO 2017 forecasts that there will be less of a difference between a future with the Clean Power Plan and without than was projected last year.
Figure 1. Comparison of electric-sector CO2 emission projections in the AEO 2017 Reference case (AEO2017 Ref) and the AEO 2017 case without the Clean Power plan (AEO2017 NoCPP) relative to the same cases in AEO 2016 (shown on this chart in dotted lines)
Despite unchanged emissions projections, generation makeup is different
One of the biggest changes in this year’s AEO, compared to last year’s edition, is the change in anticipated natural gas generation. In the Reference case, 2030 natural gas generation is expected to reach approximately 1500 terawatt hours (TWh) in 2030. This is 200 TWh less than projected in the same case last year, a reduction of 12 percent. At the same time, coal generation and renewable generation are essentially unchanged through 2030, relative to last year’s projections. Interestingly, the new AEO 2017 modeling suggests that even without the Clean Power Plan, coal generation is expected to remain at levels of about 1,400 TWh, 30 percent below the all-time peak set in the mid-2000s.
Figure 2. Comparison of electricity generation from coal, natural gas, and renewables in the AEO 2017 Reference case (AEO2017 Ref) relative to the same cases in AEO 2016 (shown on this chart in dotted lines)
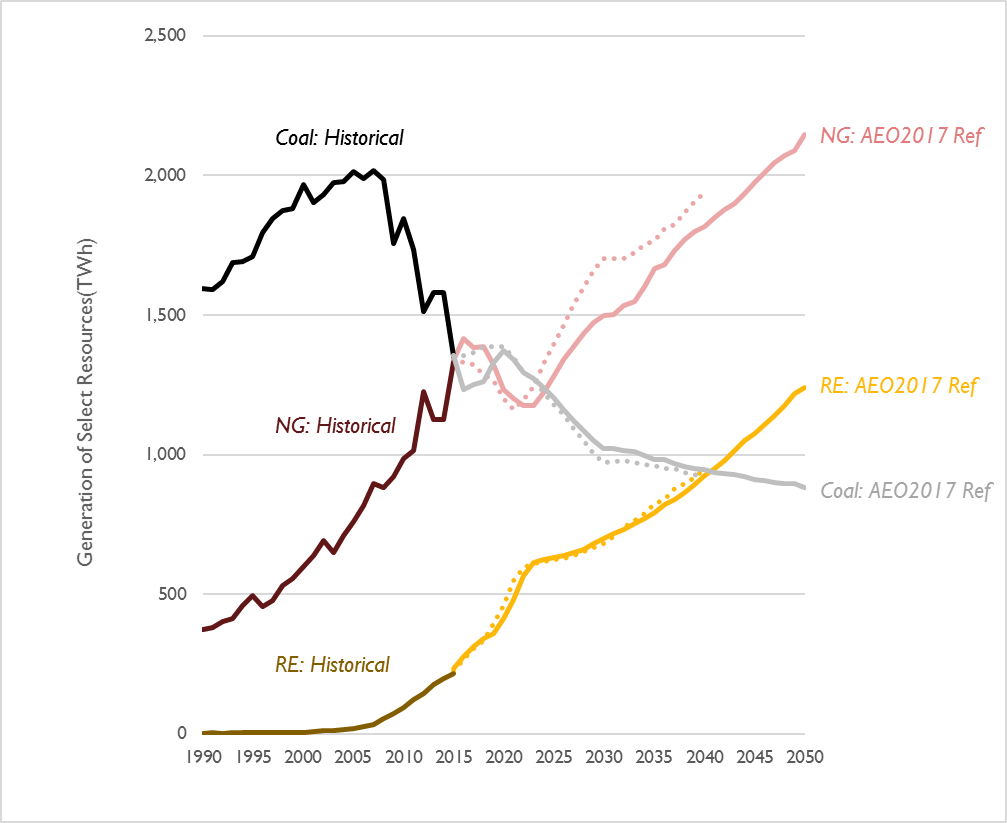
Note: In this figure, “Renewables” includes all generation from wind and solar. Generation from hydro, geothermal, and biomass is excluded.
These changes in anticipated natural gas generation occur in spite of new projections that point to lower natural gas prices. In the AEO 2017 Reference case, the natural gas wellhead price projection has remained essentially the same as last year until 2022. Prices are then projected to be 8 percent lower through 2030, relative to last year’s forecast.
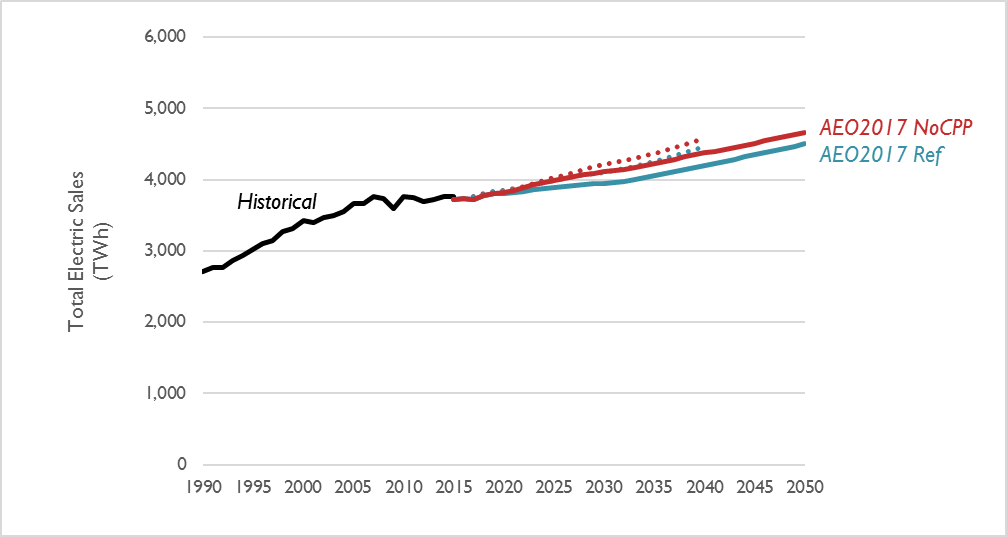
If projected natural gas generation is down, but projections of coal and renewable generation have both only slightly increased, what is filling the gap in 2030? A big part of the answer is a reduction in projected electric sales. AEO 2017 forecasts a 4 percent reduction in 2030 sales compared to last year’s analysis. For every 3 megawatt hours (MWh) less natural gas-fired generation in the AEO 2017 Reference case, 2 MWh can be attributed to lower electric sales.
Figure 3. Comparison of electricity sales projections in the AEO 2017 Reference case (AEO2017 Ref) and the AEO 2017 case without the Clean Power plan (AEO2017 NoCPP) relative to the same cases in AEO 2016 (shown on this chart in dotted lines)
Despite electric sales decreases, AEO 2017 projects many more electric vehicles than in the past
Even though electric sales are projected to decrease, relative to past projections, AEO 2017 projects that the number of electric vehicles (EVs) on the road in 2030 is expected to be 2.2 times as high as EIA projected in last year’s modeling. By 2050, EIA projects EVs to comprise about 4 percent of all light-duty vehicles. At the same time, the latest AEO projects a significant shift in the types of vehicles on the road from cars to trucks. By 2050, AEO 2017 projects that non-electric cars will comprise 44 percent of all non-electric light-duty vehicles on the road, compared to 50 percent in 2015. In terms of emissions, the switch to electric vehicles offsets the switch to trucks, resulting in a 2030 fleetwide fuel efficiency of about 30 MPG, down about 4 percent from last year’s modeling exercise.
Figure 4. Light-duty vehicle stock in the AEO 2017 Reference case (AEO16) and the AEO 2016 Reference case (AEO17).
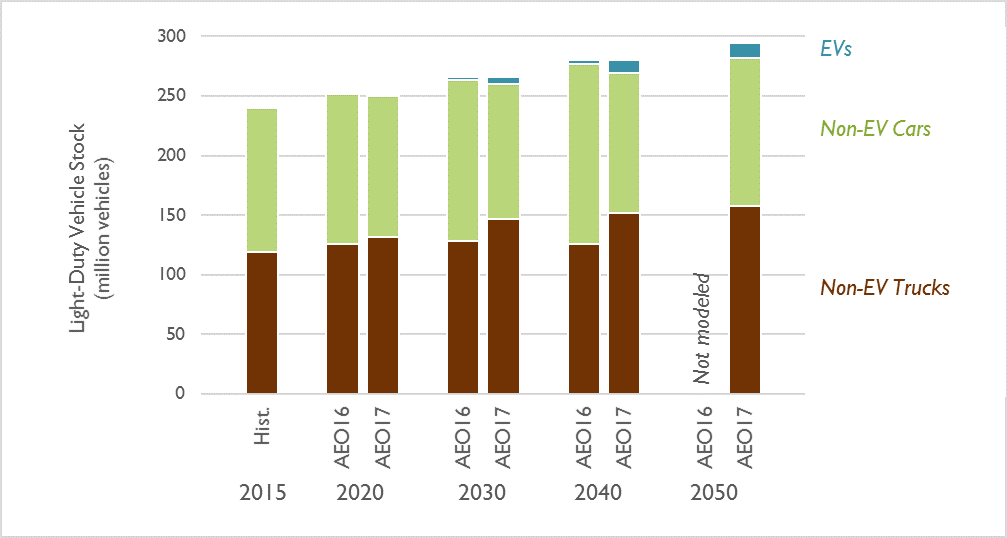
Note: “EVs” only includes all-electric vehicles. Hybrids and plug-in hybrids, as well as all other alternative light-duty vehicles, are included in “Non-EV Cars” and “Non-EV Trucks.”
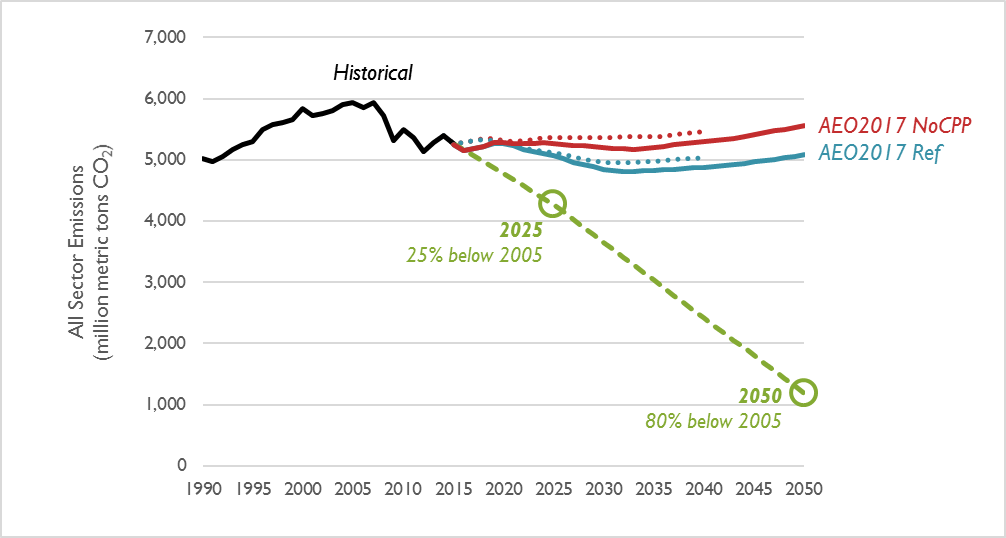
Emissions from all sectors continue to exceed the limit needed to avert catastrophic climate change
According to the 2015 U.S. Report to the United Nations Framework Convention on Climate Change, national CO2 emissions will need to reduce by 25 percent by the year 2025 and 80 percent by the year 2050 to avert catastrophic climate change. The AEO 2017 Reference case features marginally lower emissions than AEO 2016 (a cumulative decrease of 1 percent between 2017 and 2030), and features 2050 emissions over four times higher than is recommended by climate scientists (see Figure 5). Synapse recommends that future editions of the AEO model scenarios with policies that achieve these long-term emission reduction targets.
Figure 5. Comparison of all-sector CO2 emission projections in the AEO 2017 Reference case (AEO2017 Ref) and the AEO 2017 case without the Clean Power plan (AEO2017 NoCPP) relative to the same cases in AEO 2016 (shown on this chart in dotted lines) and the level needed to avert catastrophic climate change (shown on this chart as a dashed line)