AEO 2018 projects further coal decline in favor of higher levels of renewables and natural gas
On February 6, 2018, the U.S. Energy Information Administration (EIA) released the 2018 Annual Energy Outlook (AEO). The final AEO 2018 contains projections of energy use from the electric power, residential, commercial, industrial, and transportation sectors through 2050. It is important to note that the AEO Reference case is not a forecast, but is instead a projection based on estimates of fuel availability, changes in technology costs, and currently enacted legislation. Note that changes after October 2017 (including revisions to tax laws and solar tariffs) are not included in AEO 2018.
As in prior years, EIA has released a Reference case alongside many other cases exploring futures with higher or lower economic growth and oil and gas availability. Those side cases show a variety of possible futures, although the overall energy demand growth is modest in all of them. All of them show greenhouse emissions at close to, or above, current levels in 2050.
Different in AEO 2018 is the removal of the U.S. Environmental Protection Agency’s Clean Power Plan from the Reference case. Instead, analysis of this proposed regulation has been moved to a side case titled “Reference case with Clean Power Plan.” For the purposes of this blog post, most of our comparisons are between the AEO 2018 Reference Case and the AEO 2017 Reference case without the Clean Power Plan. Here are some key highlights from AEO 2018:
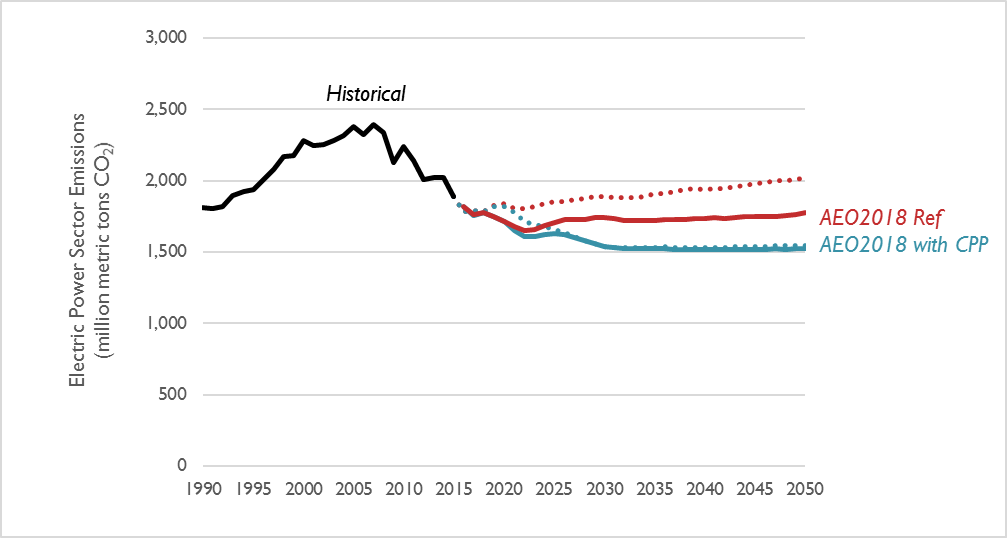
Electric-sector CO2 emissions are projected to decrease, relative to AEO 2017
Electric sector carbon dioxide (CO2) emissions are 7 percent lower in the latest AEO 2018 Reference case relative to the analogous AEO 2017 projection, when looking at the entirety of CO2 emitted between 2018 and 2030 (Figure 1). For cases with the Clean Power Plan, AEO 2018 projects lower near-term emissions but similar long-term emissions, relative to AEO 2017. Importantly, both AEO 2018 cases project nearly identical emission levels through the mid-2020s.
Figure 1. Comparison of electric-sector CO2 emission projections in the AEO 2018 Reference case (AEO2018 Ref) and the AEO 2017 case with the Clean Power plan (AEO2018 with CPP) relative to the analogous cases in AEO 2017 (shown on this chart in dotted lines)
Lower emissions are due to a different makeup of generation
Continuing the trend from last year’s AEO, EIA is projecting a further increase in natural gas generation and a further decrease in coal generation. EIA has also revised its projection of renewable generation upward.
- Natural gas: In the near-term, EIA projects much higher levels of natural gas generation than in the previous year’s projections. By 2030, EIA projects natural gas generation to increase to 1500 TWh, 14 percent higher than in the AEO 2017 Reference case without the Clean Power Plan.
- Coal: Between 2019 and 2030, EIA’s projection of coal generation is 16 percent lower than in the previous year’s projection, on average. EIA projects a reduction in coal generation through 2022, followed by relatively stable levels of generation after that.
- Renewables: EIA projects an average increase in wind and solar generation of 8 percent between 2019 and 2030, relative to last year’s AEO. Between 2019 and 2030, solar generation increases by a factor of 2.8 with a relatively constant year-on-year increase. Over the same time period, wind generation increases by a factor of 1.6. However, much of this increase occurs between 2019 and 2022; wind capacity (and by association, generation) is virtually unchanged from 2022 to 2044, resulting in even lower levels of wind generation than in previous AEO projections. Synapse’s interpretation is that the expiration of the Production Tax Credit is the main driver of the flatlining of wind capacity in EIA’s modeling. Note that AEO 2018 does not seem to account for state-specific requirements or targets to procure offshore wind capacity (as is the case in Massachusetts, New York, and several other states).
Figure 2. Comparison of electricity generation from coal, natural gas, and renewables in the AEO 2018 Reference case (AEO2018 Ref) relative to the “without Clean Power Plan” cases in AEO 2017 (shown on this chart in dotted lines)
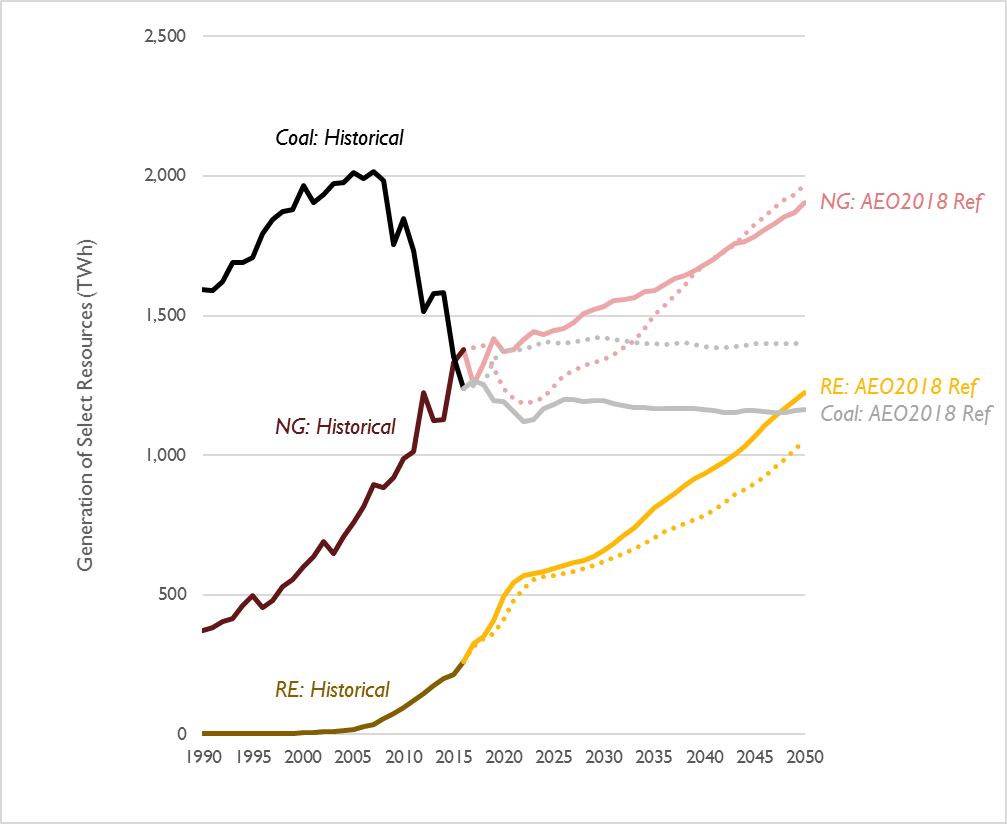
Note: In this figure, “Renewables” includes all generation from wind and solar. Generation from hydro, geothermal, and biomass is excluded.
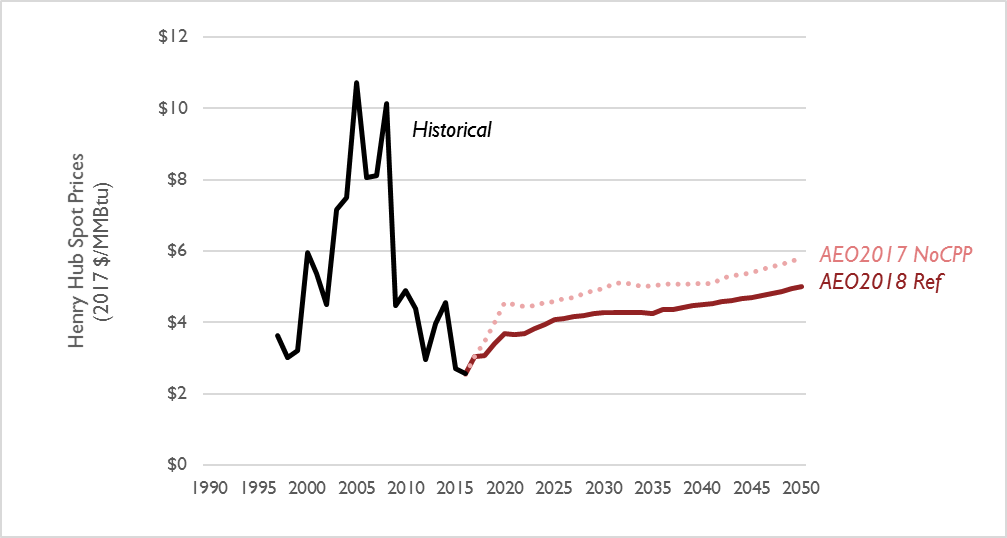
These changes in natural gas and coal generation are due in part to lower projections of natural gas prices in the latest AEO. Between 2019 and 2030, natural gas prices are projected to be 14 percent lower than in last year’s AEO projection. However, EIA does not project these sustained low natural gas prices to substantially impact the cumulative amount of coal retirements, which remain relatively constant after the mid-2020s.
Figure 3. Comparison of natural gas prices at the Henry Hub in the AEO 2018 Reference case (AEO2018 Ref) relative to the “without Clean Power Plan” cases in AEO 2017 (shown on this chart as a dotted line)
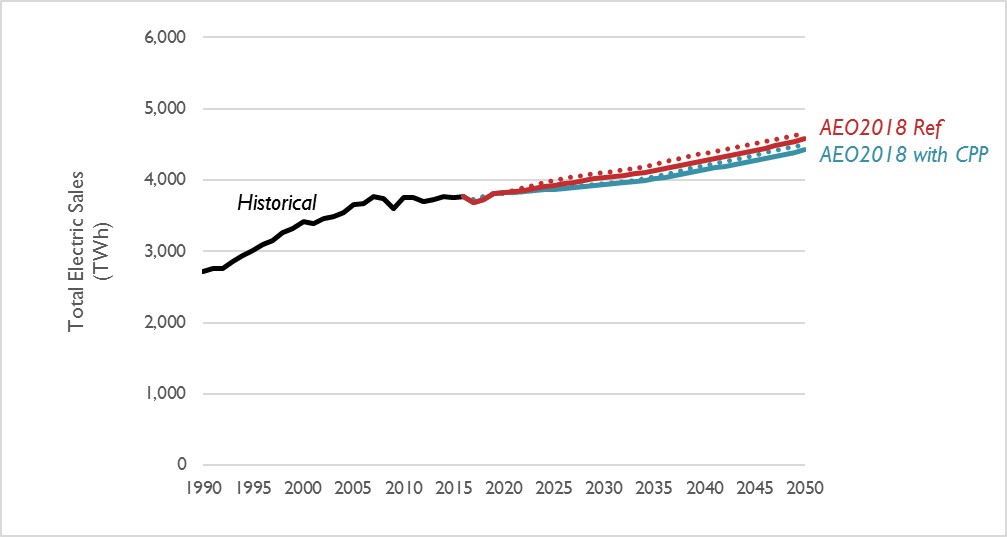
Aggregated electricity generation from coal, natural gas, renewables, and other resources in AEO 2018 are virtually unchanged compared to last year’s projection. This is directly related to the fact that EIA has also not significantly revised its projection for electricity sales (see Figure 4). As in previous versions of the AEO, EIA projects that the implementation of the Clean Power Plan would have a small overall impact on electricity sales.
Figure 4. Comparison of electricity sales projections in the AEO 2018 Reference case (AEO2018 Ref) and the AEO 2018 case with the Clean Power plan (AEO2018 with CPP) relative to the analogous cases in AEO 2017 (shown on this chart in dotted lines)
Through 2030, EIA projects fewer cars on the road and similar numbers of electric vehicles
EIA has revised its projection of light duty vehicles (i.e., cars, SUVs, and small trucks) through its study period. Through 2030, the overall impact is a shift to more cars, rather than trucks, tied to changes in customer preferences relating to gasoline prices and fuel economy (note that it is also possible that this shift is due to a reclassification of crossover utility vehicles—“CUVs”—to the “cars” category). Both AEO 2018 and last year’s projection estimate that by 2030, 2 to 3 percent of light duty vehicles will be powered by electricity. However, the latest AEO projects that the share of electric vehicles will increase to 10 percent by 2050.
Figure 5. Light-duty vehicle stock in the AEO 2018 Reference case (AEO18) and the AEO 2017 Reference case without the Clean Power Plan (AEO17)
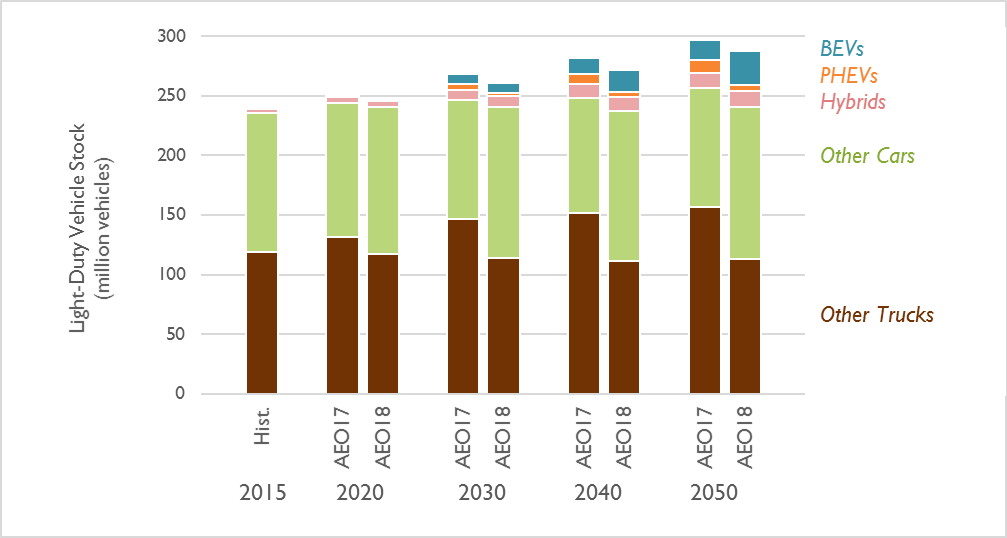
Note: “BEVs” includes all-electric vehicles. “PHEVs” includes plug-in hybrids, while “Hybrids” constitutes non-plug-in hybrids. All other alternative light-duty vehicles are included in “Other Cars” and “Other Trucks.”
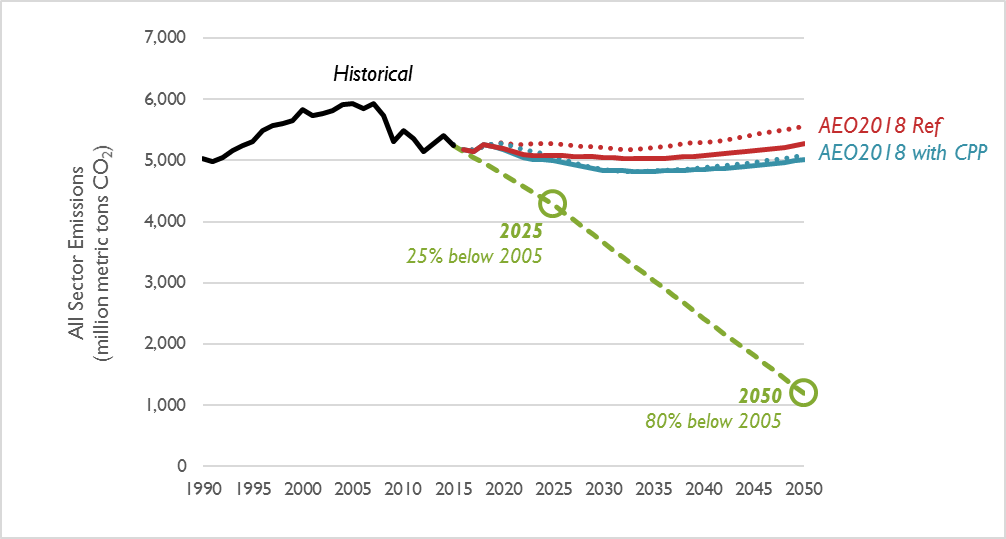
Emissions from all sectors continue to exceed the limit needed to avert catastrophic climate change
According to the 2015 U.S. Report to the United Nations Framework Convention on Climate Change, national CO2 emissions will need to reduce by 25 percent by the year 2025 and 80 percent by the year 2050 to avert catastrophic climate change. The AEO 2018 Reference case features marginally lower emissions than AEO 2017 (a cumulative decrease of 4 percent between 2018 and 2050), and features 2050 emissions nearly four-and-a-half times higher than is recommended by climate scientists (see Figure 6).
Synapse recommends that future editions of the AEO model scenarios with policies that achieve these long-term emission reduction targets.
Figure 6. Comparison of all-sector CO2 emission projections in the AEO 2018 Reference case (AEO2018 Ref) and the AEO 2018 case with the Clean Power plan (AEO2018 with CPP) relative to the analogous cases in AEO 2017 (shown on this chart in dotted lines) and the level needed to avert catastrophic climate change (shown on this chart as a dashed line)