AEO 2019 cliff notes: Lower coal, higher natural gas, and unchanged renewables
On January 24, 2019, the U.S. Energy Information Administration (EIA) released the 2019 Annual Energy Outlook (AEO). AEO 2019 contains projections of energy use from the electric power, residential, commercial, industrial, and transportation sectors through 2050. As in prior years, EIA has released a Reference case alongside many other cases exploring futures with various levels of economic growth and oil and gas availability. AEO 2019’s Reference case does not represent a forecast; instead, it’s a projection based on estimates of fuel availability, changes in technology costs, and current legislation.
Modeling in AEO 2019 reflects tax law revisions passed by Congress in December 2017, new data from EIA’s latest Residential Energy Consumption Survey, updated assumptions for residential and commercial end-use technology, and updated vehicle stock data. AEO 2019 also now accounts for drilling in the Arctic National Wildlife Refuge after 2030, incorporates updated assumptions for the solar Investment Tax Credit, and includes updates to state-specific renewable portfolio standards.
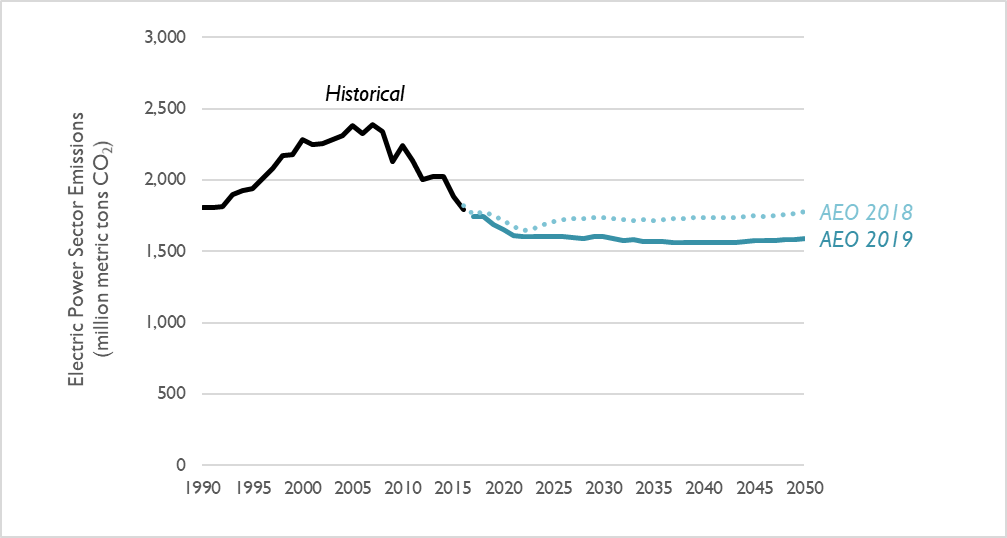
Electric-sector CO2 emissions are projected to decrease, relative to AEO 2018
Compared to last year’s AEO projection, electric sector carbon dioxide (CO2) emissions are 6 percent lower in AEO 2019, when looking at the entirety of CO2 emitted between 2019 and 2030 (Figure 1). Interestingly, this means that cumulative emissions over this time period (as modeled in AEO 2019) are 1 percent lower than the last AEO scenario modeling the now-repealed Clean Power Plan.
Figure 1. Comparison of electric-sector CO2 emission projections in the AEO 2019 and 2018 Reference case
Lower emissions are due to a different makeup of generation
Continuing the trend from last year’s AEO, EIA is projecting a further increase in natural gas generation and a further decrease in coal generation. EIA has also revised its projection of renewable generation upward.
- Natural gas: In the near-term, EIA projects much higher levels of natural gas generation than in the previous year’s projections. By 2030, EIA projects natural gas generation to increase to about 1,750 terawatt hours (TWh), 14 percent higher than in last year’s reference case.
- Coal: Between 2019 and 2030, EIA’s projection of coal generation is 13 percent lower than in the previous year’s projection, on average. As in AEO 2018, EIA projects a reduction in coal generation through 2022, followed by relatively stable levels of coal generation through the early 2030s. Coal then sees a small decrease in generation through 2050.
- Renewables: AEO 2019 projects that solar generation will increase by a factor of 2.8 between 2019 and 2030, with a relatively constant year-on-year increase. This is up from a factor of 2.0, as projected in AEO 2018. Meanwhile, AEO 2019 projects that wind generation will increase by a factor of 1.3 between 2019 and 2030, relative to a factor of 1.4 projected in AEO 2018. The majority of these wind additions occur prior to 2022; as in AEO 2018, wind generation is nearly flat through 2030 (though it does begin to increase again—albeit marginally—in the late 2030s). These changes in wind and solar projections offset each other, resulting in a combined renewable projection that is almost unchanged from AEO 2018.
Figure 2. Comparison of electricity generation from coal, natural gas, and renewables in the AEO 2019 and 2018 Reference cases (series from AEO 2018 are shown as dotted lines)
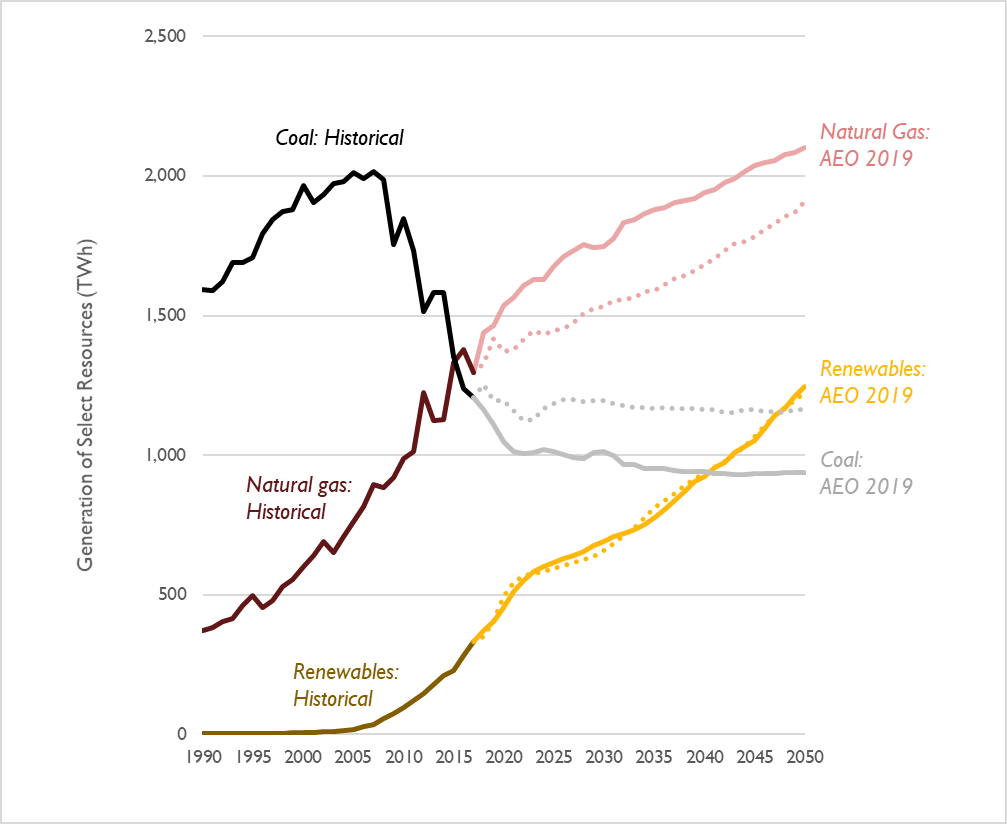
Note: In this figure, “Renewables” includes all generation from wind and solar. Generation from hydro, geothermal, and biomass is excluded.
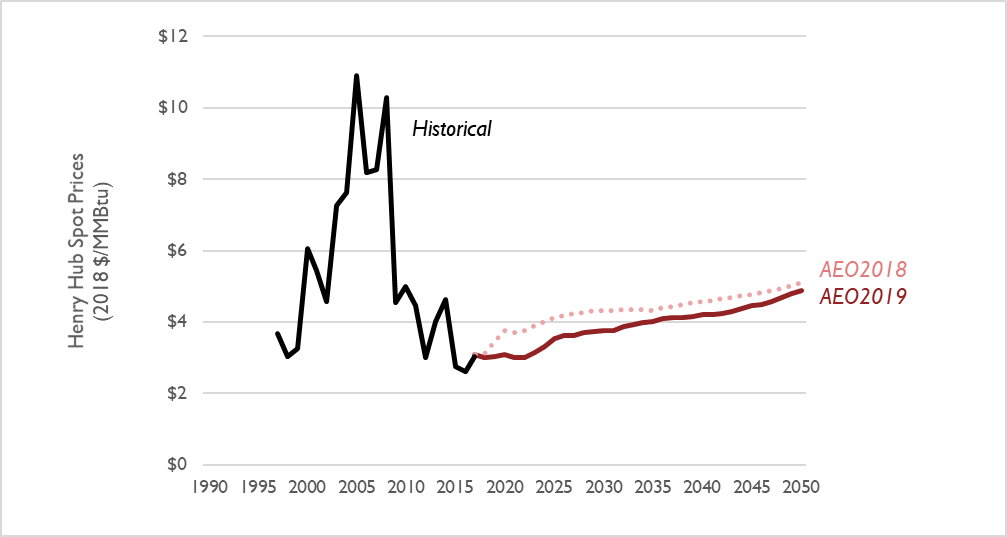
The shifts in natural gas and coal generation are due in part to lower projections of natural gas prices in the latest AEO (see Figure 3). Between 2019 and 2030, natural gas prices are projected to be 16 percent lower than in last year’s AEO projection, with particularly low prices in near-term. These low gas prices help drive 75 GW of coal retirements by 2030 (equivalent to about 30 percent of present-day coal capacity).
Figure 3. Comparison of natural gas prices at the Henry Hub in the AEO 2018 Reference case (AEO2018 Ref) relative to the “without Clean Power Plan” cases in AEO 2017 (shown on this chart as a dotted line)
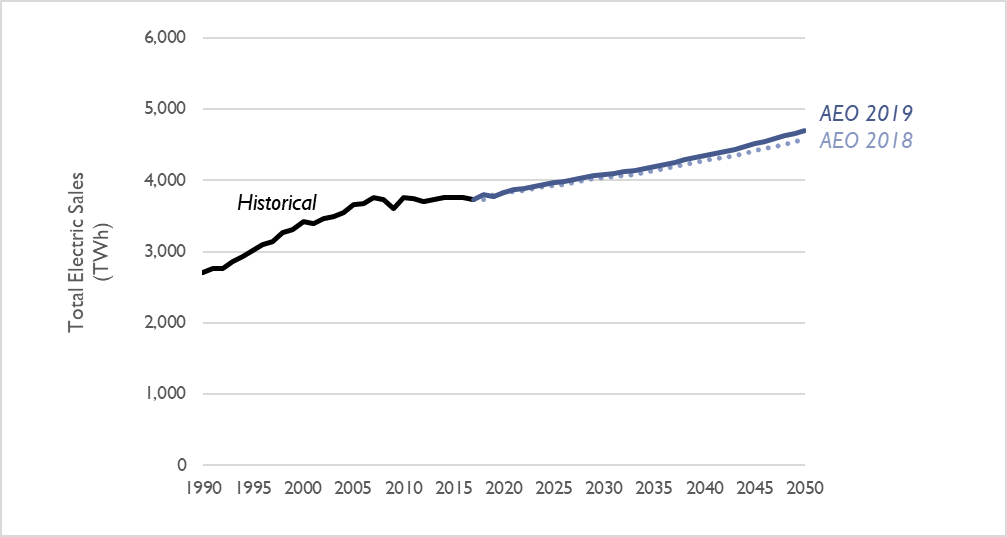
Aggregated electricity generation from coal, natural gas, renewables, and other resources in AEO 2018 are virtually unchanged compared to last year’s projection. This is because EIA has not significantly revised its projection for electricity sales (see Figure 4). Between 2019 and 2030, projected electricity sales are, on average, 0.7 percent higher per year relative to AEO 2018. By 2030, this represents a 10 percent increase in sales relative to today’s levels.
Figure 4. Comparison of electricity sales projections in the AEO 2019 and AEO 2018 Reference cases
Through 2030, EIA projects more cars on the road but higher amounts of electric vehicles
EIA has revised its methodology behind its projection of light duty vehicle (LDV) stock (i.e., cars, SUVs, and small trucks) through its study period. This revision results in a total increase in LDVs of 5 percent by 2030. In AEO 2019, the number of cars expected to be powered by electricity has increased; in 2030, plug-in hybrid and fully battery-powered EVs are expected to together constitute 5 percent of LDV stock, up from 4 percent in AEO 2018.
Figure 5. Light-duty vehicle stock in the AEO 2019 and 2018 Reference cases
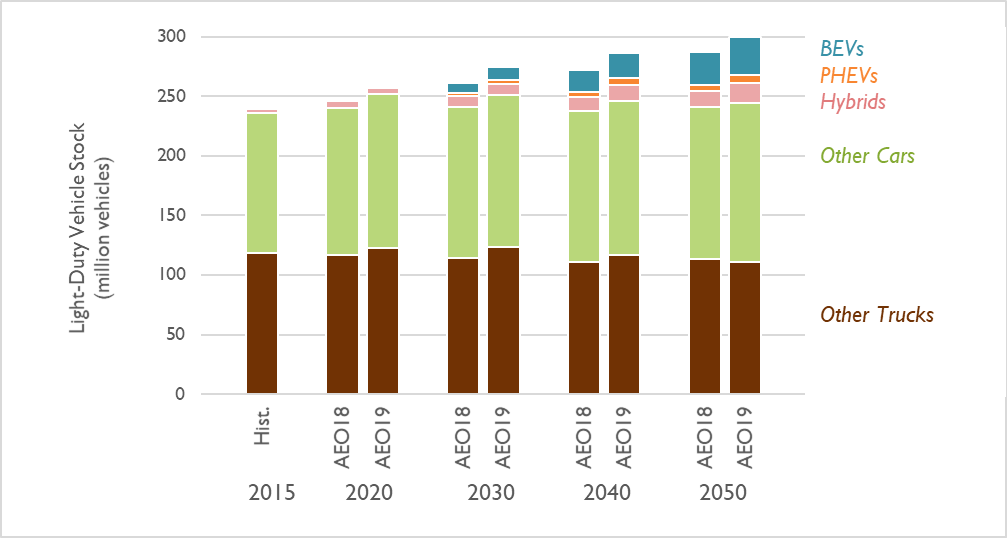
Note: BEVs includes all-electric vehicles. PHEVs includes plug-in hybrids, while Hybrids constitutes non-plug-in hybrids. All other alternative light-duty vehicles are included in Other Cars and Other Trucks.
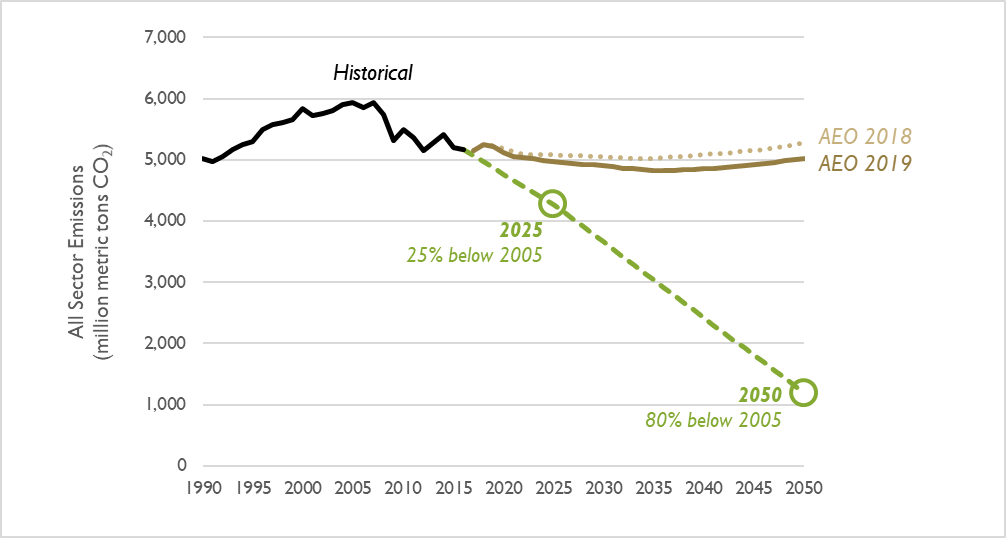
Emissions from all sectors continue to exceed the limit needed to avert catastrophic climate change
According to the 2015 U.S. Report to the United Nations Framework Convention on Climate Change, national CO2 emissions need to reduce by 25 percent by the year 2025 and 80 percent by 2050 to avert catastrophic climate change. The AEO 2019 Reference case features marginally lower emissions than AEO 2018 (a cumulative decrease between 2019 and 2050 of 3 percent). In 2050, AEO 2019 projects emissions will be 4.2 times higher than what is recommended by climate scientists (see Figure 6).
Synapse recommends that future editions of the AEO model cases with policies that achieve these long-term emission reduction targets.
Figure 6. Comparison of all-sector CO2 emission projections in the AEO 2019 and 2018 Reference cases relative to the level needed to avert catastrophic climate change (shown on this chart as a dashed line)