EIA Publishes Early Release of Annual Energy Outlook 2016
On May 17, 2016, the U.S. Energy Information Administration (EIA) published an early release of its Annual Energy Outlook (AEO) for 2016. This early release contains projections for two scenarios: a Reference case, which includes the effects of the Clean Power Plan, and a “No Clean Power Plan” case, which examines a future in which there is no Clean Power Plan. Final versions of each of these cases, along with projections for numerous other scenarios, will be available on July 7, 2016. Until then, here are some of the key highlights in the latest AEO:
The AEO 2016 Reference case projects that the Clean Power Plan will raise electricity prices by just 3 percent compared to a future with no Clean Power Plan.
As a result of the Clean Power Plan, EIA projects that average electricity prices in the years 2025 to 2030 will be 3 percent higher than a future with no Clean Power Plan. However, the AEO 2016 Reference case (inclusive of the Clean Power Plan) features electricity prices 3 percent below the electricity prices forecasted just last year in the AEO 2015 Reference case.
Importantly, this 3 percent increase is limited just to electricity prices; EIA assumes that in the Clean Power Plan, electricity providers purchase CO2 allowances, the revenues of which are rebated to ratepayer bills (just as is currently done in Regional Greenhouse Gas Initiative states). As a result, the full effect on out-of-pocket spending on electricity by ratepayers is lower than 3 percent, or even zero.
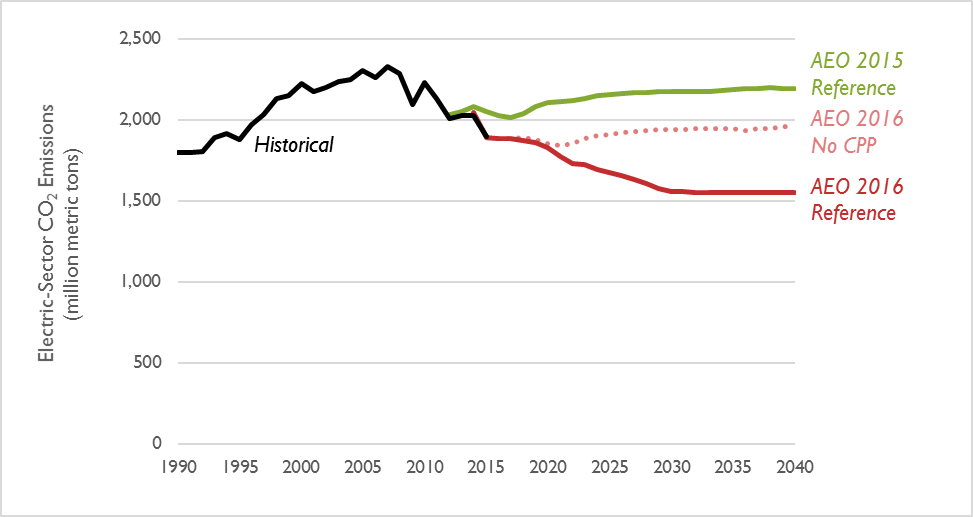
The AEO 2016 Reference case models a 32 percent decrease in electric sector CO2 emissions in 2030
By following the mass-based approach to the Clean Power Plan, AEO 2016’s Reference case reduces electric sector CO2 emissions by over 30 percent by 2028 (compared to 2005 levels), and it sustains this reduction through 2040 (see Figure 1 below). This level of emissions is also nearly 30 percent lower than that projected in last year’s AEO 2015. Even in the No CPP case, CO2 emissions are significantly lower than both historical emissions (a reduction of 16 percent compared to 2005) and what was previously projected (a reduction of 11 percent compared to last year’s AEO 2015 Reference case).
Figure 1. Electric power carbon dioxide emissions, historical and projected
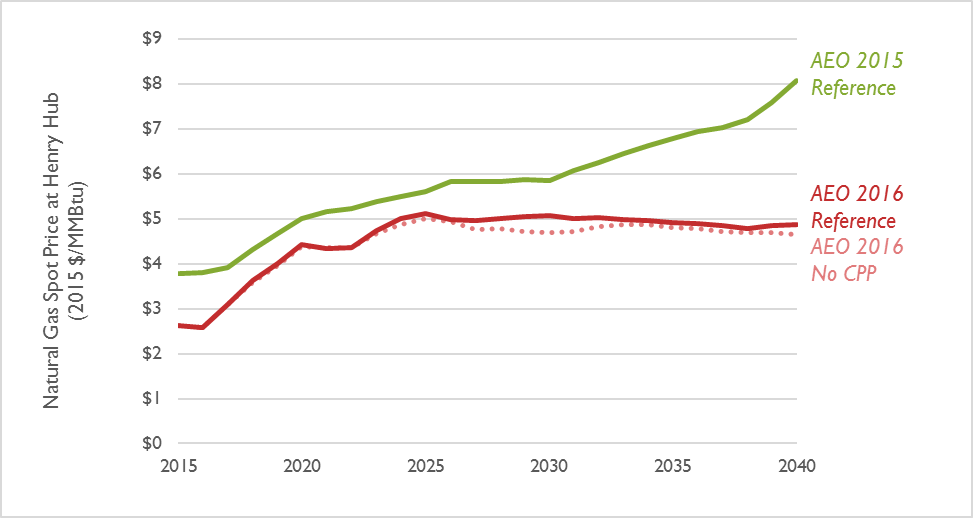
EIA projects natural gas prices to be sustained at $5 per MMBtu through 2040
In the latest AEO 2016 Reference case, EIA projects natural gas prices to increase from $2.62 per MMBtu to $4.43 per MMBtu in 2020 and to levels of about $5 per MMBtu in 2025 (see Figure 2). EIA projects this price level (in constant dollars) to then be sustained throughout the remainder of the study period. Between 2015 and 2040, these prices are projected to be 22 percent lower on average than the spot price at Henry Hub forecasted in last year’s AEO 2015 Reference case. Increased gas demand resulting from the Clean Power Plan results in a small increase in prices between 2025 and 2030, but otherwise this finding holds true for the No CPP scenario as well.
Figure 2. Natural gas spot prices at Henry Hub
AEO forecasts over 300 GW of net capacity additions and nearly 100 GW of net capacity retirements
As a result of sustained low natural gas prices, environmental compliance requirements, and natural equipment aging, the AEO 2016 Reference case forecasts the retirements of over 50 GW of coal capacity (see Figure 3). This represents about 15 percent of total coal capacity in existence today. At the same time, the AEO 2016 Reference case projects over 100 GW of new natural gas combined cycle capacity being added between 2016 and 2040, and nearly 200 GW of new solar and wind added over the same period. As a result, two-thirds of all new capacity added through 2040 comes from renewables, as opposed to traditional fossil fuel generation. Without the Clean Power Plan, EIA projects fewer coal retirements, as well as fewer natural gas, solar, and wind additions.
Figure 3. Net capacity change from 2016 to 2040
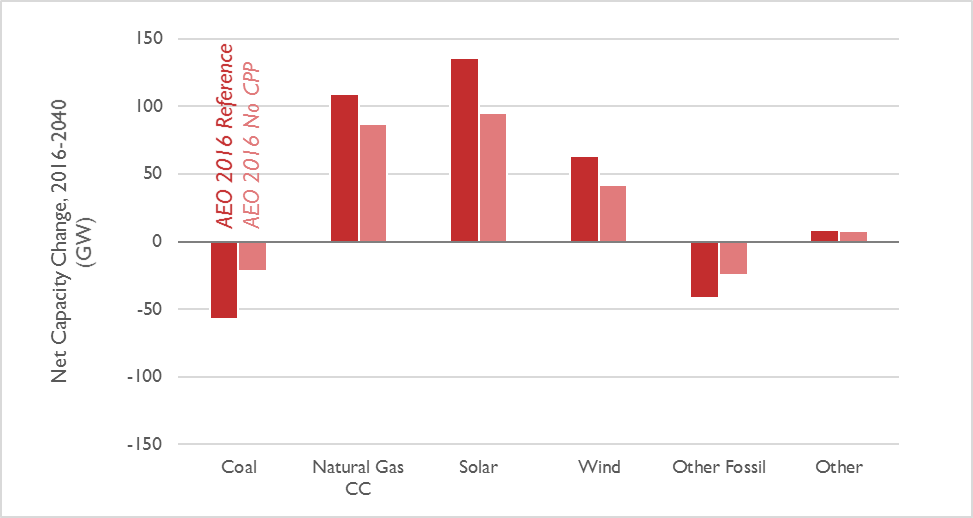
Note: “Other Fossil” includes oil and gas steam units and combustion turbines. “Other” includes distributed generation (including distributed PV), hydro, pumped storage, geothermal, biomass, and other miscellaneous resources.