EV-REDI Is Ready for Launch
Synapse has a new EV tool! Our new EV-REDI (Electric Vehicle Regional Emissions and Demand Impacts) tool models multiple impacts of transportation electrification for specific states. With electric vehicles on the rise, there will be enormous opportunities for making transportation more sustainable and modernizing the electric grid. But to realize this potential, it will be necessary to plan ahead. More and more, states, cities, utilities, and regional authorities are seriously considering the impacts of futures in which electric vehicles play an increasingly important role in the transportation sector. EV-REDI can help meet the need to quantify the impacts of increased EV penetration on electricity sales, greenhouse gas emissions, and avoided gasoline consumption.
EV-REDI relies on high-resolution data from publicly available sources to assemble state-specific information on the historical adoption of EVs and develop trajectories of future EV deployment. EV-REDI can integrate with electric sector dispatch models to inform capacity expansion and hourly dispatch, such as Synapse’s M-SEM (which can be used to develop a comprehensive picture of future emissions across all energy sectors), or AVERT (an official EPA tool developed by Synapse) to examine high-resolution CO2 and criteria pollutant emission impacts on the electricity grid.
EV-REDI allows us to apply a technology adoption curve to existing historical trends to understand the impacts of EVs if current trends in adoption are sustained over time. Alternatively, EV-REDI can be used to analyze specified future levels of electric vehicle sales in absolute terms or in percentage terms, or set the total number of EVs (stock) in absolute terms or percentage terms. Under either approach, EV-REDI then quantifies both conventional and electric light-duty vehicle (LDV) sales and stock, and the resultant impacts on electricity sales, tailpipe emissions, gasoline consumption, and other metrics through 2050. For every state, Synapse’s model accounts for:
- State-specific trends in light-duty vehicle stocks, sales, and driving patterns
- Vehicle ownership lifetime
- Vehicle miles travelled (VMT)
- Changing efficiencies of both EVs and conventional vehicles
- Changing trends in vehicle preferences
- Distinctions between driving patterns of plug-in hybrid electric vehicles (PHEVs) and purely battery-powered electric vehicles (BEV)
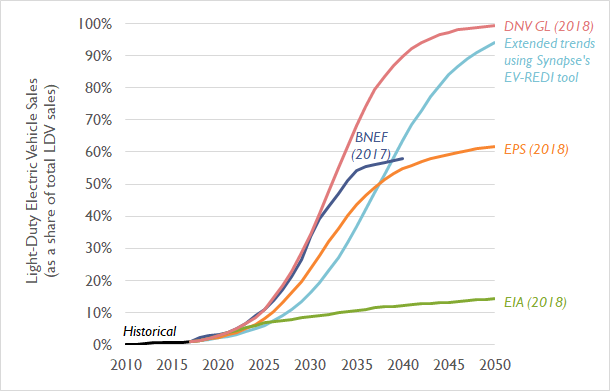
Numerous other organizations, including Bloomberg New Energy Finance (BNEF), the Energy Information Administration (EIA), DNV GL, and Energy Innovation have recently published projections of EV adoption. Synapse has created a hypothetical scenario in which each state continues its trend of electric vehicle deployments, assuming that these trends follow a typical S-shaped sales adoption curve similar to those observed for other new technologies deployed in recent decades (see Figure 1). Note that the Synapse trajectory does not necessarily represent a “most likely” projection of EV sales; it is possible that future EV sales trajectories may be significantly different than recent historical data points would otherwise indicate. Under this assumed trajectory, EV sales expand from a level of about 1 percent of all LDV sales in 2017, to 6 percent in 2025, and nearly 95 percent by 2050.
Figure 1. Recent projections for electric vehicle sales
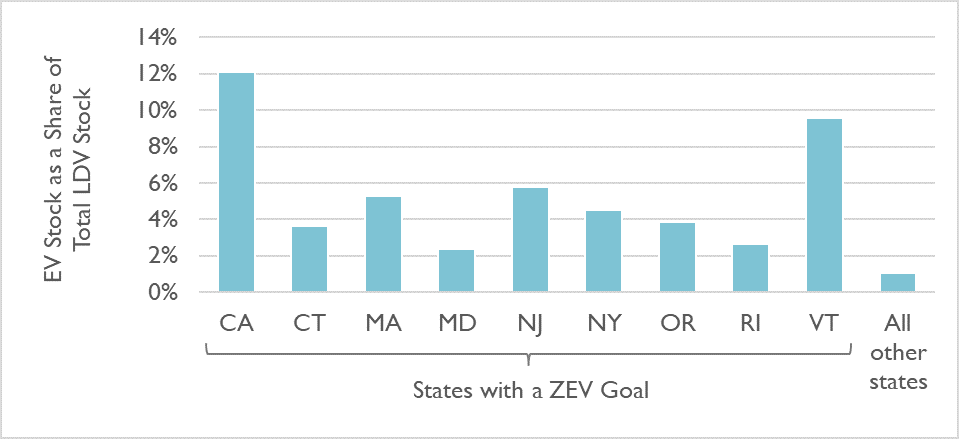
Nine states (representing one out of every four cars in the United States) have a stated Zero Emissions Vehicle (ZEV) goal of collectively putting 3.3 million EVs on the road by 2025. These states are among the leading states for EVs today—as of 2017, two-thirds of all EVs are in California, and one out of every twenty cars bought in California is an EV. Under Synapse’s modeled scenario, these nine states are projected to achieve 5.3 million EVs on the road in 2025, 61 percent above their aggregate goal (see Figure 2). Under this projection, EVs throughout the United States in 2025 are estimated to avoid 1.6 billion gallons of gasoline, reduce CO2 emissions in the transportation sector by 14 million metric tons, and increase retail electricity demand by 25 TWh.
Figure 2. Percentage of vehicles on the road that are electric in ZEV states in 2025
Further studies of EVs will be needed to determine the full scope of this new technology’s impact on the energy system. For example, as EVs charge using the electric grid, they may increase CO2 emissions from the electric sector that may partially offset the emissions avoided through decreased use of gasoline. The impacts on electricity customers are also an important element to understand. Greater electricity sales due to EVs may help to exert downward pressure on rates as the fixed costs of the grid are spread across more kilowatt-hours. However, this effect will be uneven and will depend on state-specific penetration levels, as well as where and when EV charging occurs. As the deployment of electric vehicles increases, policymakers will need to contend with the hourly impacts of EVs on the grid, including considerations relating to peak demand and rate design. Synapse has studied the grid impacts of EVs to date in California and is developing a series of reports on best practices in EV rate design.