Get in the Know on AEO
Get in the Know on AEO: A guide to EIA’s latest energy projection through 2050
On January 29, 2020, the U.S. Energy Information Administration (EIA) released the 2020 Annual Energy Outlook (AEO). AEO 2020 contains projections of energy use from the electric power, residential, commercial, industrial, and transportation sectors through 2050. AEO 2020’s Reference case does not represent a forecast; instead, it’s a projection based on estimates of fuel availability, changes in technology costs, and current legislation.
Every even-numbered year, AEO conducts in-depth revisions to underlying input assumptions and methodologies and analyzes more sensitivities than in odd-numbered years. For example, modeling in AEO 2020 reflects changes to underlying modeling topology to better reflect the current state of the national electricity system. The January 2020 release includes modeling sensitivities which assess various levels of economic growth and oil and gas availability, and different projections of renewable costs. This includes, for instance, a case exploring the impact of lower renewable costs than the Reference case and a case where renewable costs do not change from present day. An upcoming March 2020 release will feature additional modeling runs which examine future scenarios in a number of states implementing decarbonization polices, as well as the impacts of a national carbon fee policy.
Electric-sector CO2 emissions are projected to substantially decrease, relative to AEO 2019
Compared to last year’s AEO projection, electric sector carbon dioxide (CO2) emissions are 15 percent lower in AEO 2020, when looking at the entirety of CO2 emitted between 2020 and 2030 (Figure 1). This decrease is most notable in years 2020-2025, where CO2 emissions decrease by 3.2 percent per year on a compound annual basis for AEO 2020, versus 0.6 percent per year over the same period in AEO 2019.
Figure 1. Comparison of electric-sector CO2 emission projections in the AEO 2020 and 2019 Reference case 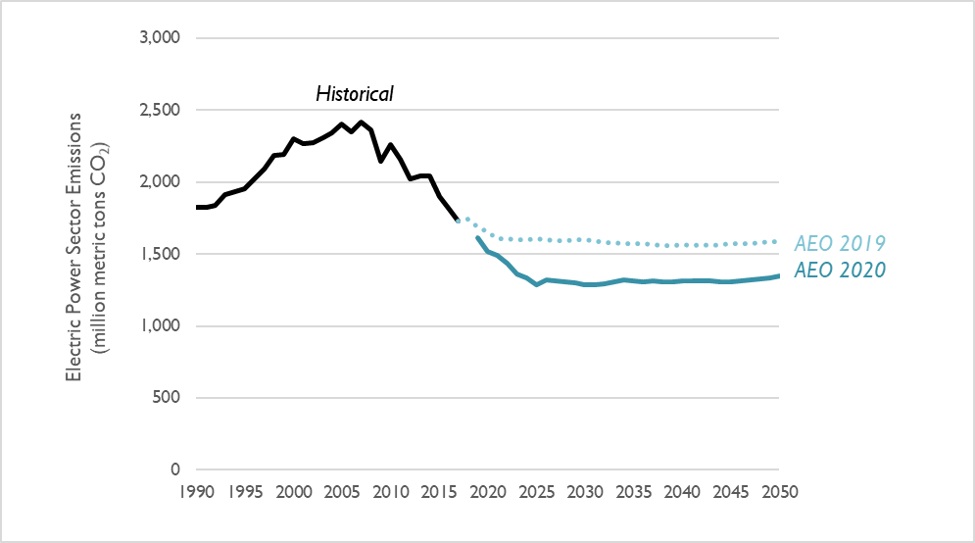
Lower emissions are due to an increasingly clean electricity sector
Continuing the trend from the past several years’ AEO projections, EIA is projecting a further increase in natural gas generation and a further decrease in coal generation. EIA has also yet again revised its projection of renewable generation upward.
- Natural gas: In the near term, EIA projects lower levels of natural gas generation than in the previous year’s projections. Although gas generation increases in the near term, by 2030, EIA projects natural gas generation to flatten from the early 2020s through the early 2030s. In 2030, gas generation is 10 percent lower than in last year’s reference case.
- Coal: EIA is projecting coal generation to continue to plummet from now until 2025, with total generation falling from about 1,150 terawatt-hours (TWh) in 2018 to 730 TWh in 2025. Coal generation rebounds slightly in the late 2020s as several nuclear plants retire, and it is then projected to stabilize through 2050.
- Wind and solar: AEO 2020 projects that solar generation will increase by a factor of 3.3 between 2020 and 2030, with a relatively constant year-on-year increase. This is up from a factor of 2.4, as projected in AEO 2019. Meanwhile, AEO 2020 projects that wind generation (including offshore wind) will increase by a factor of 1.7 between 2020 and 2030, relative to a factor of 1.1 projected in AEO 2019. The majority of these wind additions occur in the early 2020s as in AEO 2019; however, wind installations are projected to continue to increase after 2025, unlike last year’s projection.
Combined, wind and solar generation is expected to surpass generation from coal by 2024.
Figure 2. Comparison of electricity generation from coal, natural gas, and wind and solar in the AEO 2020 and AEO 2019 Reference cases (series from AEO 2019 are shown as dotted lines) 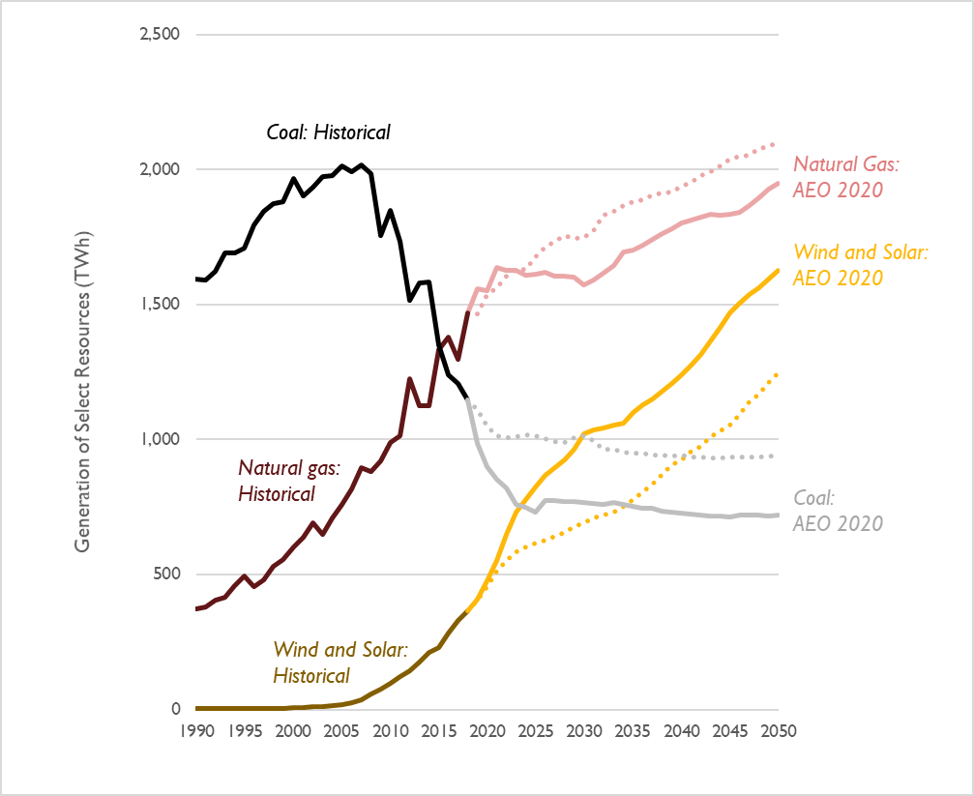 Note: Generation from hydro, nuclear, geothermal, biomass, and other miscellaneous sources are not included in this figure.
The shifts in natural gas and coal generation are due in part to yet still lower projections of natural gas prices in the latest AEO (see Figure 3). Between 2020 and 2030, Henry Hub natural gas prices are projected to be 19 percent lower than in last year’s AEO projection, with prices around $2.50 per MMBtu in the near term. These low gas prices help drive 95 GW of coal retirements by 2030, equivalent to 40 percent of present-day coal capacity.
Figure 3. Comparison of natural gas prices at the Henry Hub in the AEO 2020 and AEO 2019 Reference cases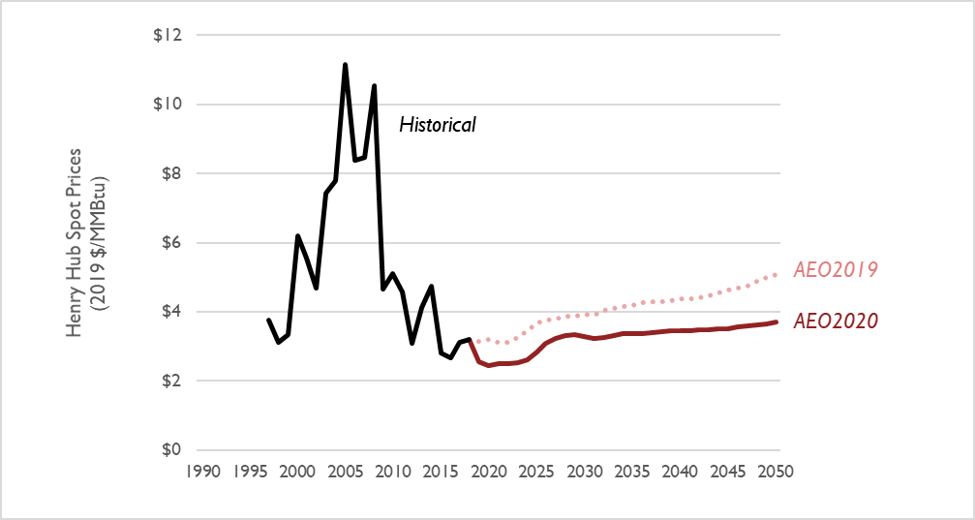
Aggregated electricity generation from coal, natural gas, renewables, and other resources in AEO 2020 are virtually unchanged compared to last year’s projection. This is because EIA has not significantly revised its projection for electricity sales (see Figure 4). Between 2020 and 2030, projected electricity sales are, on average, 2 percent lower per year relative to AEO 2019. However, because sales are still increasing, by 2030, total electricity sales are 7 percent higher than today.
Figure 4. Comparison of electricity sales projections in the AEO 2020 and AEO 2019 Reference cases 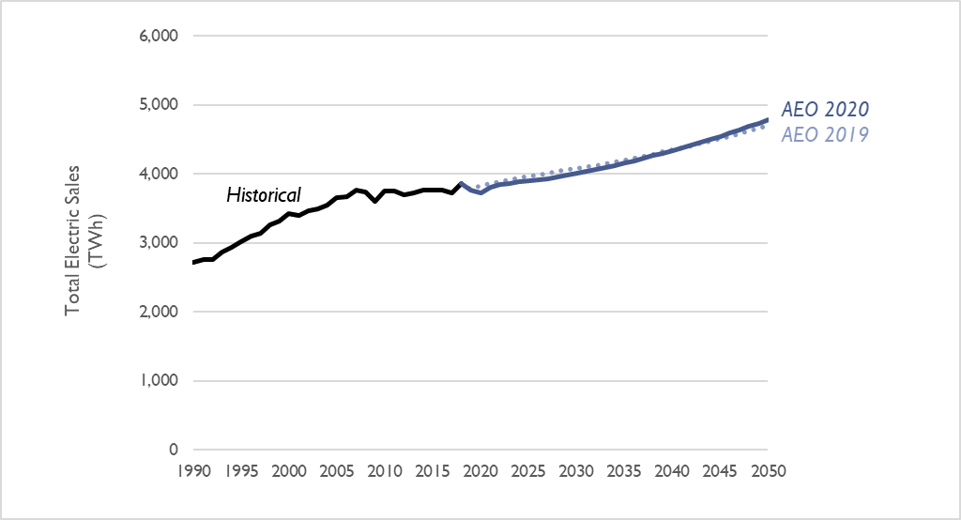
EIA projects a reduced share of electric vehicles through 2050
In the latest AEO, EIA projects that the number of cars on the road is virtually unchanged compared to AEO 2019 projections. What’s more, the latest AEO projects an increasing shift to light trucks, rather than passenger cars. However, the differences between these two categories is becoming increasingly blurred, with the majority of both categories being made up by crossover vehicles of various sizes by 2030. Note that AEO is continuing to model current CAFE standards as being in place (as opposed to being rolled back or advanced). Although electric vehicles (including battery EVs and plug-in hybrid EVs) represent about 13 percent of total vehicle sales by 2050, these vehicles constitute just 10 percent of total vehicle stock because of the lag in vehicle lifetimes. The quantity and share of electric vehicles is decreased in this year’s AEO; this is largely due to unchanged projections of vehicle prices, continued assumed unavailability of certain types of electric vehicles (including pickups), increased average MPG of non-electric vehicles, and lower projected prices for motor gasoline through 2050.
Figure 5. Light-duty vehicle stock in the AEO 2020 and 2019 Reference cases 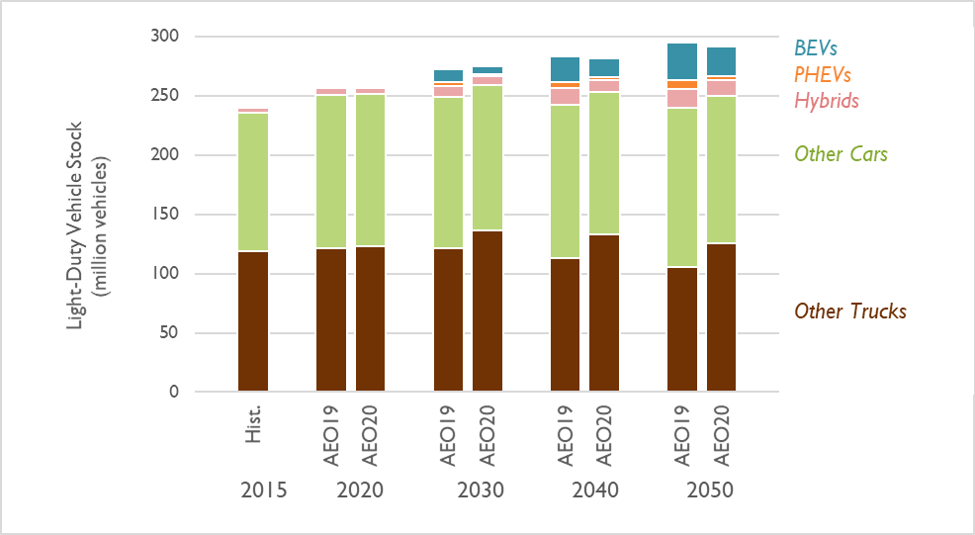 Note: BEVs includes all-electric vehicles. PHEVs includes plug-in hybrids, while Hybrids constitutes non-plug-in hybrids. All other alternative light-duty vehicles are included in Other Cars and Other Trucks.
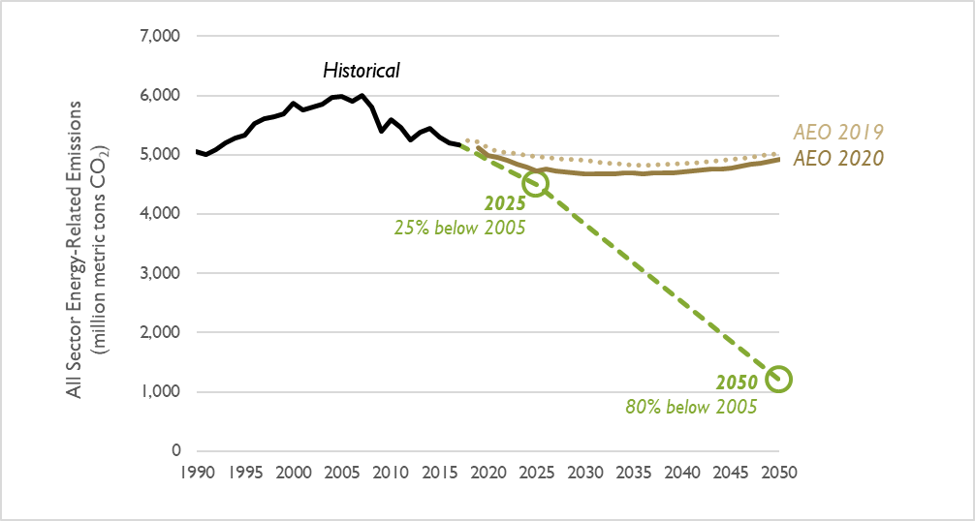
Emissions from all sectors continue to exceed the limit needed to avert catastrophic climate change
According to the 2015 U.S. Report to the United Nations Framework Convention on Climate Change, national CO2 emissions need to reduce by 25 percent by the year 2025 and 80 percent by 2050 to avert catastrophic climate change. The AEO 2020 Reference case features marginally lower emissions than AEO 2019 (a cumulative decrease between 2020 and 2050 of 3 percent). In 2050, AEO 2019 projects emissions will be 4.1 times higher than what is recommended by climate scientists (see Figure 6).
Synapse plans to post an update to this blog post in March, after EIA releases two “side cases” to the AEO that evaluate pathways to a decarbonized future.