More than a pocketful of sunshine in New England
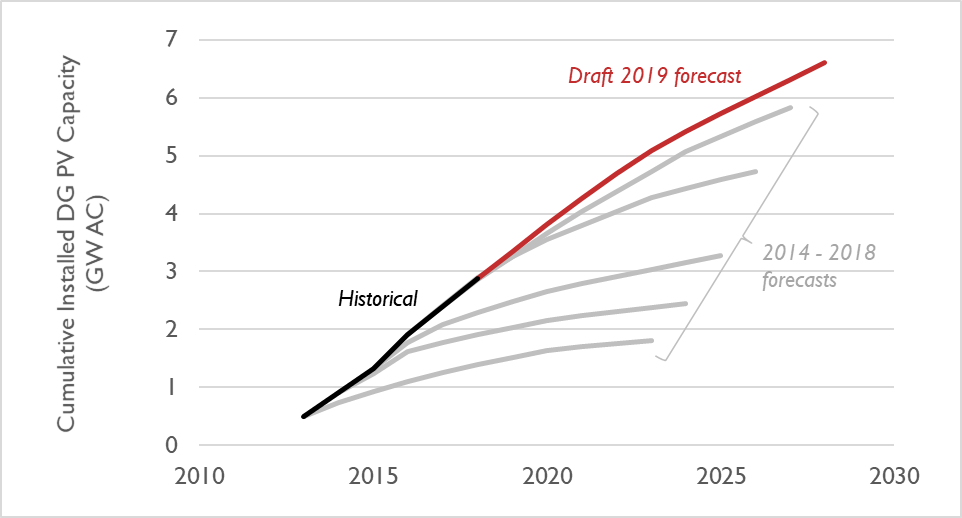
On February 11, 2019, ISO New England published its latest draft distributed solar (“DG PV”) forecast. As in previous years, ISO New England has developed this forecast based on historical data and information about public policies in the six New England states. These policies include state renewable portfolio standard (RPS) policies, long-term procurements, net energy metering, federal tax credits, and other drivers. This forecast is primarily concerned with distributed solar; the majority of distributed solar capacity does not participate in ISO New England’s wholesale markets and is otherwise difficult to quantify without a forecast (see Figure 1). This information on future quantities of distributed solar is combined with ISO New England’s two other forecasts—gross energy and energy efficiency—to provide an estimate of the likely regional electricity demand through the next decade.
Figure 1. Projections of installed DG PV capacity in New England, ISO New England’s forecasts compared to historical
This latest forecast yields the following insights:
- As of 2018, ISO records there being 2.9 gigawatts (GW) of DG PV capacity installed in New England, 65 percent of which is in Massachusetts. This is about 7 percent of total installed capacity in the region.
- By 2028, ISO projects New England having 6.6 GW of solar—2.3 times more than today’s level.
- ISO came close to projecting 2018 installed capacity correctly—it under-projected capacity by just 18 megawatts (MW), equal to about 0.6 percent. This is much better than in the previous four projections, when the margin of error was 8 percent, on average.
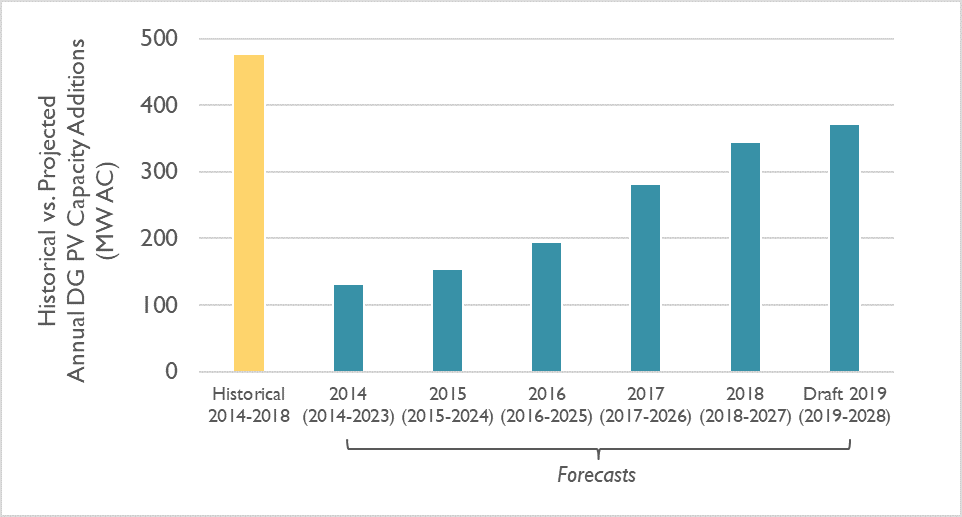
- Last year, ISO projected an annual addition of about 350 MW per year. That’s now been upgraded to about 375 MW per year (see Figure 2). However, this projection is still far below the observed, historical amount of DG PV capacity additions, which have been around 475 MW per year from 2014 to 2018.
- Importantly, ISO’s DG PV solar forecast involves a discounting of future policies. These discount factors are applied in order to address uncertainty in terms of future PV commercialization. For 2019, this discounting results in a decrease of 50 MW; by 2028, this reduction is equal to 1.4 GW.
ISO is taking comments on this forecast through February 25th; a final forecast will be released the first week of May.
Figure 2. Annual DG PV capacity in New England, ISO New England’s forecasts compared to historical