The Price of Emissions Reduction: Carbon Price Pathways through 2050
The October 2018 Intergovernmental Panel on Climate Change (IPCC) special report on climate change highlights the importance of averting catastrophic climate change. Centrally, it finds that global carbon dioxide (CO2) emissions must reach net zero by 2050 in order to limit global warming to 1.5°C. With the United States’ announced withdrawal from the 2015 Paris Climate Accord, the future of its commitment to reduce emissions 80 percent from 1990 levels is in peril. The United States continues to release approximately 20 percent of the world’s carbon emissions. Accordingly, CO2 prices are back in the news, as they represent one way to curb CO2 emissions and put the United States back on a track to mitigating climate change.
The electric sector is the second-largest source of U.S. CO2 emissions. There have been many proposals to price CO2 emissions in the electric sector, most recently the Americans for Carbon Dividends campaign. In light of this, Synapse used the EnCompass model to explore how potential nationwide CO2 prices would affect generation resource mix and CO2 emissions in the electric sector.
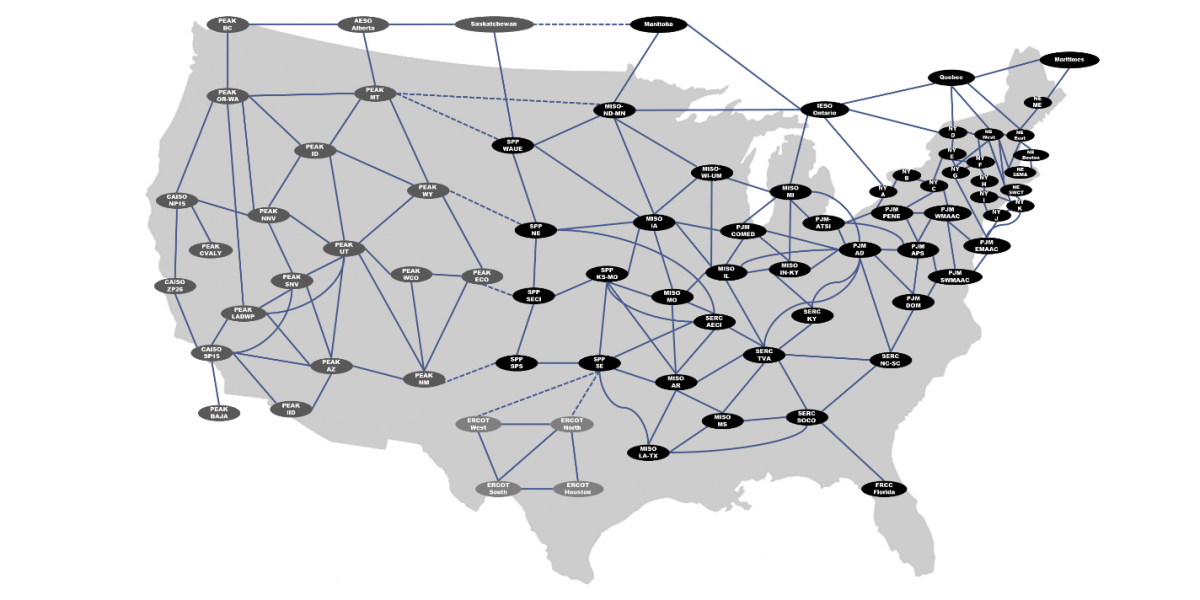
Within the EnCompass model, we use a detailed, nationwide database to find least-cost optimal solutions to questions of system build-out and dispatch. The EnCompass model considers individual power plant cost and operational parameters, regional electricity sales, and environmental programs. EnCompass can solve both long-term capacity expansion problems and short-term system dispatch problems. For example, we can use EnCompass to analyze long-term national scenarios through 2050 or to investigate hourly generation patterns in a high-renewable system. In this analysis, we used the Horizons Energy National Database, which includes unit-level data across the 76 North American areas shown below.
Figure 1. Modeled areas and links in the EnCompass National Database
For this exploratory analysis, we used the following parameters:
- Analysis Period: 2020-2050, 24 hours a day, one on- and off-peak day per month
- Performance: Detailed capacity expansion, basic hourly dispatch simulation
- Load: NERC Long-Term Reliability Assessment forecasts and steady state-level energy efficiency implementation
- Generic Power Plant Options: State-level prices for new solar, wind, battery, combined cycle, gas turbine, and internal combustion units
- CO2 Revenues: No revenue recycling
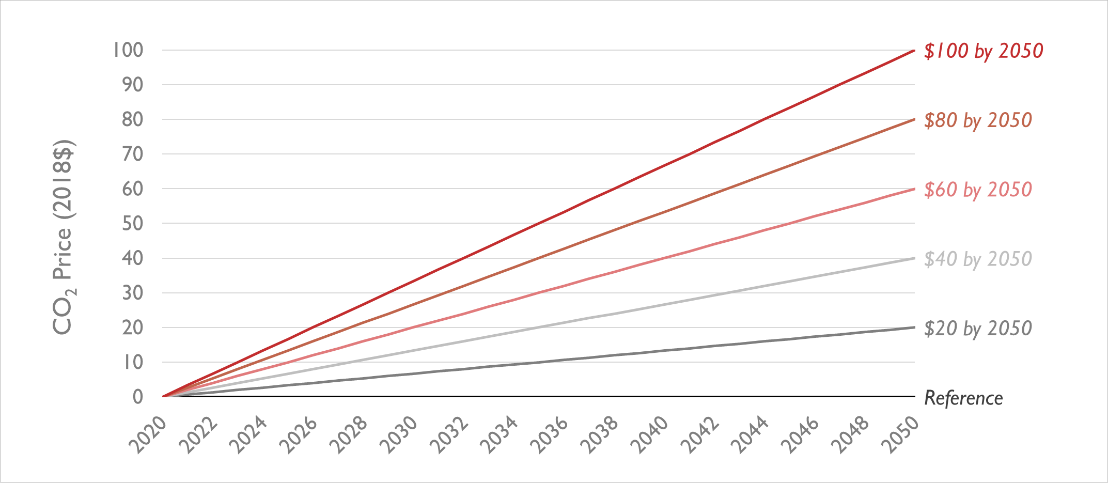
We modeled six scenarios with different linear CO2 price projections through 2050, shown in Figure 2.
Figure 2. Modeled CO2 price trajectories
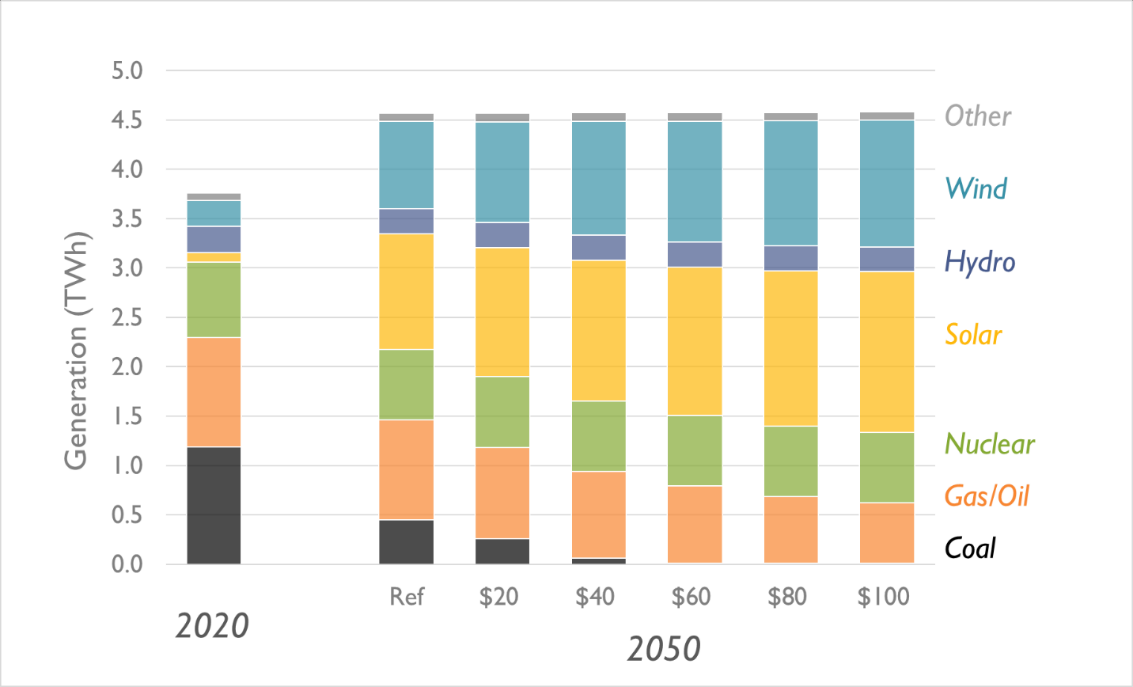
By 2050, our Reference case (featuring no carbon price) sees 36 percent less fossil generation and 278 percent more renewable generation (2 TWh) compared to estimated 2020 levels. This represents a 331 percent increase in U.S. renewable capacity, driven purely by reasonable renewable cost assumptions, even without a CO2 price. In our highest-price case, at $100 per short ton, renewable generation is 423 percent higher (3 TWh) than 2020 levels, requiring a 511 percent renewable capacity increase. Coal generation drops steadily across our scenarios—in line with higher and higher CO2 prices—and is completely phased out by 2050 in every scenario featuring a CO2 price above $60 per short ton. In our $100 by 2050 scenario, fossil generation in 2050 is 73 percent lower than 2020 levels.
Figure 3. Annual U.S. electricity generation by fuel type and scenario
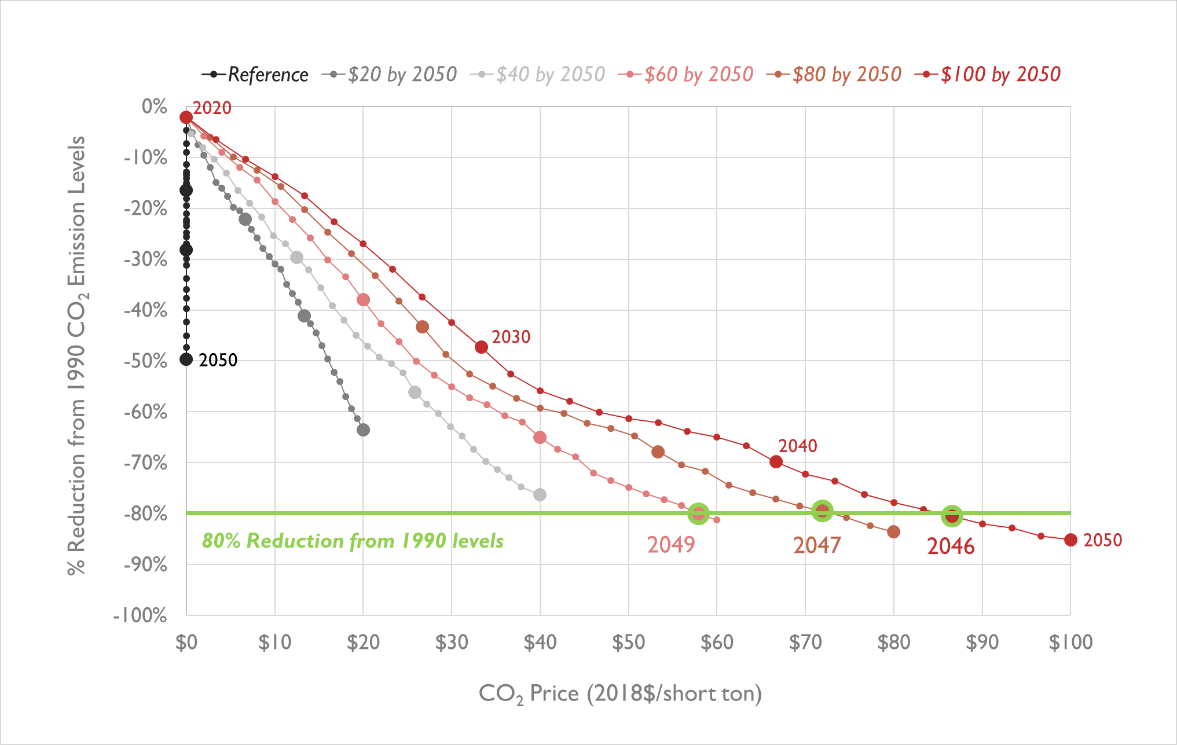
As demonstrated in Figure 4, depending on the year modeled, the same CO2 price can result in a different amount of CO2 reductions. The Reference case reduces CO2 emissions 50 percent by 2050 (relative to 1990 levels) even with no CO2 price—considerable progress but not enough to meet the United States’ Paris Accord goal. In our three highest-priced scenarios, emissions are reduced by 80 percent (relative to 1990 levels) before 2050, meeting the Paris Accord goal. In many scenarios, we observe a “flattening” in CO2 emissions reductions from 2032 to 2039. This could indicate a point at which zero-emitting resources achieve parity and begin to be rapidly deployed even without CO2 pricing.
Figure 4. CO2 emissions reductions by CO2 price, relative to 1990 levels
Topics for further exploration
- How would increased energy efficiency deployment or other demand-side reductions impact electricity generation and emissions?
- How sensitive is the model to renewable costs?
- How do changing renewable portfolio standard policies, which require utilities to procure an increasing amount of electricity from renewables over time, impact these results?
- Do regional CO2 prices produce different results than a national price?
- Do lower-range carbon prices (from $0 to $20 per short ton) result in different trends versus these scenarios?
- Do other implementation strategies (e.g., constant carbon price, carbon price expiration) result in different capacity, generation, and emissions?
- How do CO2 prices impact energy market prices?
- What is the impact of increasing electricity demand from electric vehicles or heat pumps alongside CO2 prices?
- What would happen if collected revenues from CO2 prices were recycled? Or distributed to consumers?
Got modeling questions? Let us know! Contact us at npeluso@synapse-energy.com and pknight@synapse-energy.com.