State of Electricity 2014
In 2014, the U.S. electric system looked remarkably different from how it looked ten—or even five—years ago. In the past year alone, the system nearly doubled the amount of incremental installed capacity from renewables as compared to 2013, saw a 13 percent increase in renewable generation, and reached the lowest level of CO2 emissions since 1996. Here we highlight several major trends in 2014 electric-sector capacity, generation, and CO2 emissions.
Capacity
Table 1 compares the electric generating capacity that was installed and retired in 2013 and 2014.
Table 1. Comparison of incremental electric generating capacity installed in 2013 and 2014 in gigawatts. Values displayed may not sum due to rounding.
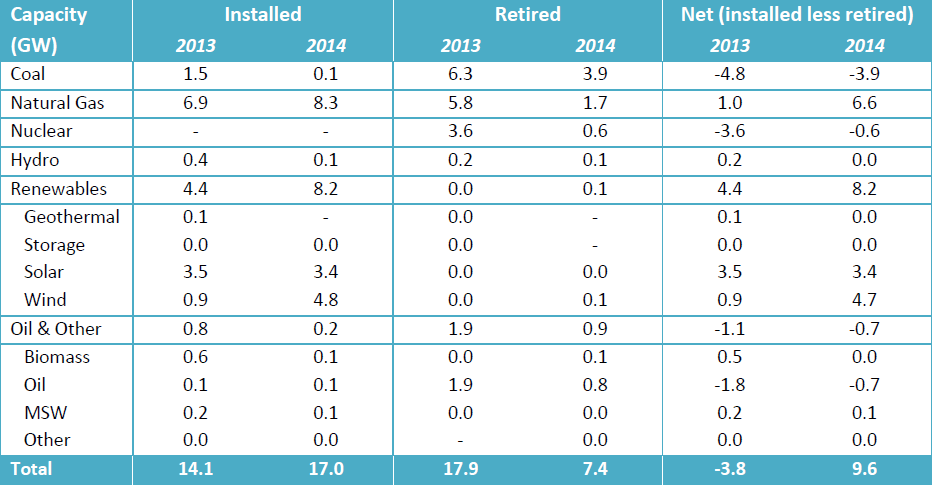
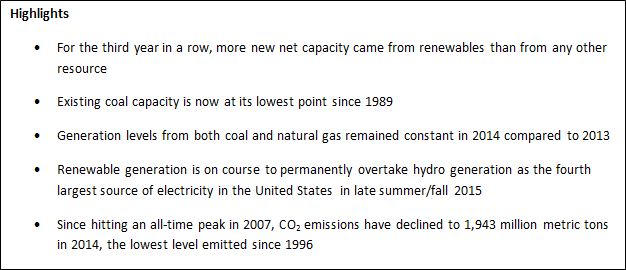
For the third year in a row, more new net capacity came from renewables than from any other resource, including natural gas.
In 2014, the majority of renewable capacity installations came from wind (4.8 GW of capacity installed, up from 0.9 GW installed in 2013). However, this value still falls short of 2012 levels, when installed wind capacity peaked at 13.4 GW. The drop is likely due to the expiration of the federal wind production tax credit at the end of 2012. (The tax credit was renewed through 2013 with modifications, but expired again in January 2014. It was renewed again in December 2014 for two weeks, then expired in January 2015.)
Incremental solar installations remained level compared to 2013, at 3.4 GW. Over one-third (38 percent) of new solar capacity came from installations at the ten largest solar facilities, nine of which are in California.
Compared to 2013, U.S. plants retired fewer gigawatts of coal in 2014 (3.9 down from 6.3). Table 2 lists major coal retirements in 2014. Existing coal capacity is now at its lowest point since 1989. A single nuclear plant retired in 2014: the 604 MW Vermont Yankee.
Table 2. Major coal plant retirements in 2014.
|
Coal Plant with 2014 Unit Retirements |
State |
Summer Capacity (MW) |
|
Alma |
WI |
103 |
|
B L England |
NJ |
113 |
|
Ben French |
SD |
22 |
|
Elrama Power Plant |
PA |
460 |
|
Green Bay West Mill |
WI |
34 |
|
Indian River Generating Station |
DE |
165 |
|
John Sevier |
TN |
352 |
|
Mount Tom |
MA |
144 |
|
Neil Simpson |
WY |
15 |
|
Osage (WY) |
WY |
30 |
|
Reid Gardner |
NV |
298 |
|
Rio Bravo Poso |
CA |
33 |
|
Riverton |
KS |
38 |
|
Salem Harbor |
MA |
744 |
|
Sunbury Generation LP |
PA |
382 |
|
W S Lee |
SC |
200 |
|
Walter C Beckjord |
OH |
802 |
|
Widows Creek |
AL |
444 |
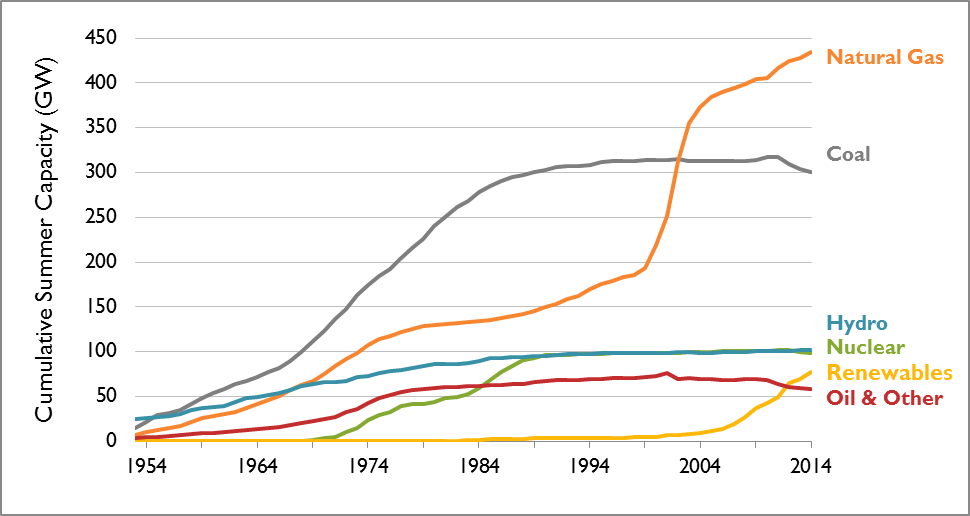
Since 2012, total renewable capacity has exceeded capacity from "oil & other" resources. The level of renewable capacity is now at about 76 percent of the level of both total hydro capacity and total nuclear capacity (both roughly 100 GW).
Figure 1 shows incremental capacity additions from 1954 through 2014, and Figure 2 shows cumulative capacity additions from 1954 through 2014.
Figure 1. Incremental capacity additions, 1954-2014. This figure displays net summer values; annual capacity retirements are subtracted from annual capacity additions. Capacity is displayed if it existed in that year (i.e., capacity that retired in the year of 2014 is not shown in this chart).
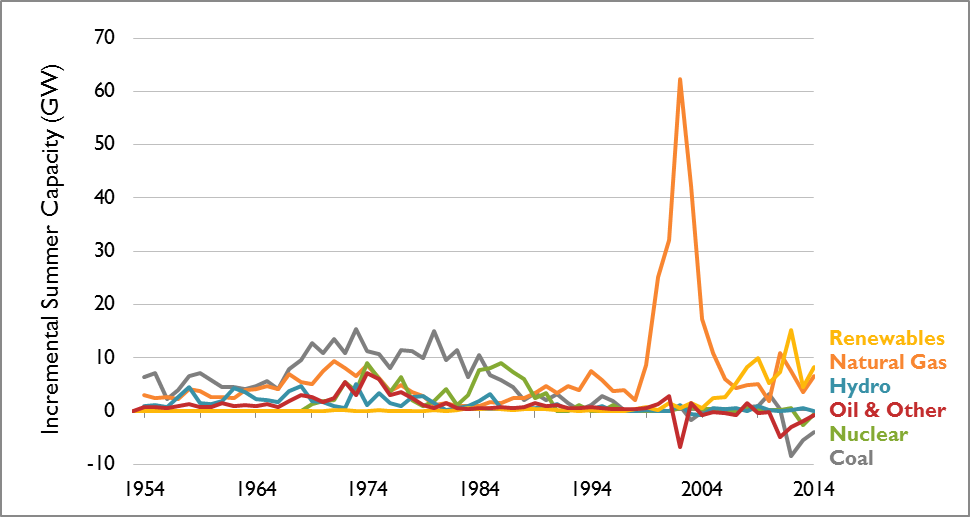
Figure 2. Cumulative capacity installed, 1954-2014.
Generation
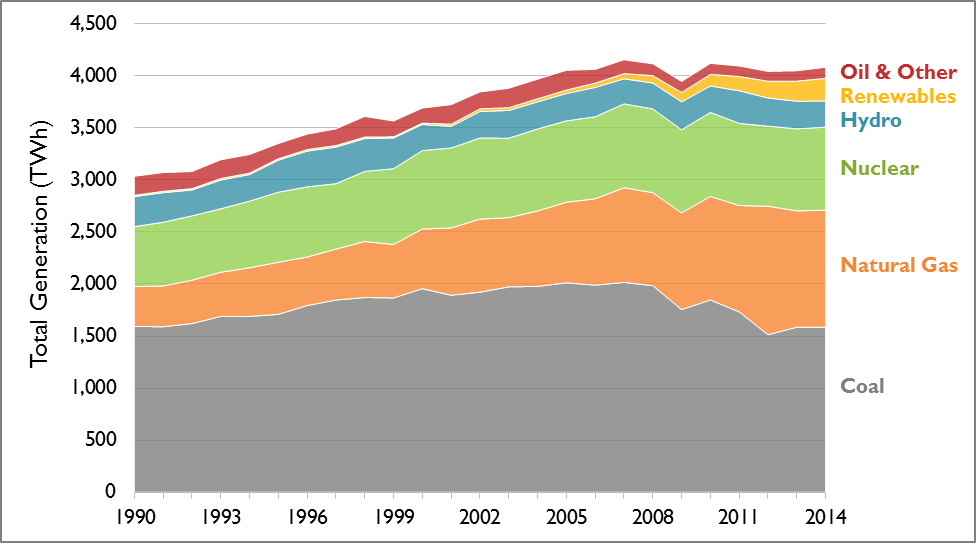
Since 1990, nationwide electric generation has increased by a third. However, in the last ten years, generation has only increased by 1 percent. Between 2013 and 2014, generation increased by less than 1 percent.
Change in generation in 2014 compared with 2013 can mostly be characterized as a 4 percent drop in hydro generation and a 13 percent increase in renewable generation. Generation levels from both coal and natural gas remained constant in 2014 compared to 2013. As in 2013, the ratio of natural gas to coal generation (0.70 GWh generated from natural gas per every 1 GWh generated from coal in both 2013 and 2014) is down from the 2012 ratio (0.80:1).
Figure 3 shows the annual generation for each resource type between 1990 and 2014.
Figure 3. Annual electric generation, 1990-2014.
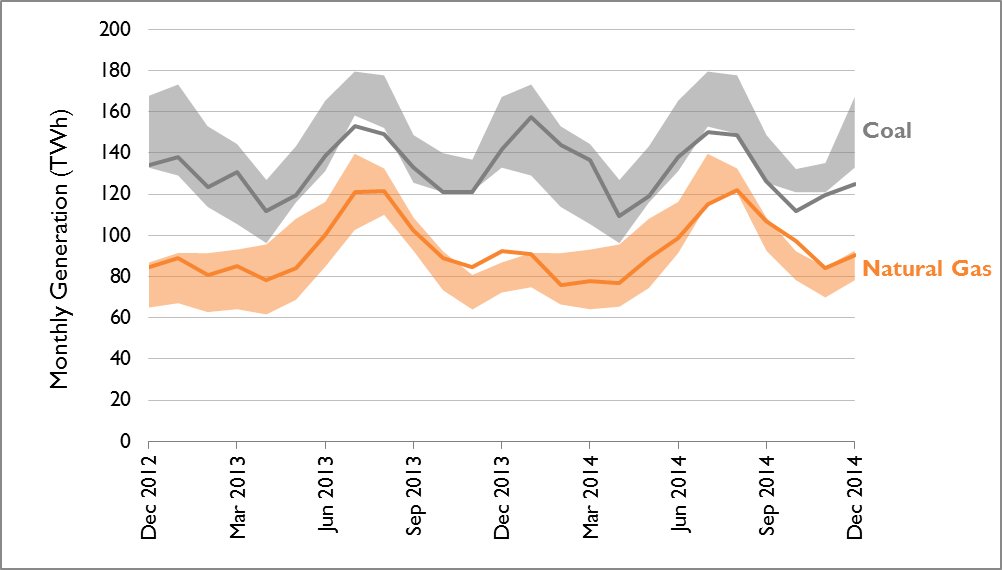
Despite the dip in the ratio of natural gas to coal generation from 2012, trends from the second half of 2014 might suggest that the gap in generation between these two resources is closing. Figure 4 shows the monthly generation for natural gas and coal overlaid on the four-year range for that month for each resource. In the first half of 2014, coal and natural gas generation trended in the middle of their respective four-year ranges. However, in four of the last six months of 2014, coal generation was lower than the four-year minimum in all but one month, and natural gas generation was higher than the four-year maximum in all but one month.
Figure 4. Monthly trends in coal and natural gas generation compared to the previous four-year range (e.g., the December 2014 coal value is compared to the range of coal generation in December 2010, December 2011, December 2012, and December 2013).
Despite recent gains in solar capacity additions, renewable generation continues to be dominated by wind. For example, in December 2014, wind made up 86 percent of total renewable generation. Even so, solar has made remarkable strides in the past year—annual solar generation doubled compared to 2013 and quadrupled compared to 2012. Total renewable generation increased by 13 percent from 2013 to 2014. Figure 5 displays the monthly generation for wind and solar overlaid on the four-year ranges for each resource type.
Figure 5. Monthly trends in solar, geothermal, and wind generation compared to the previous four-year range.
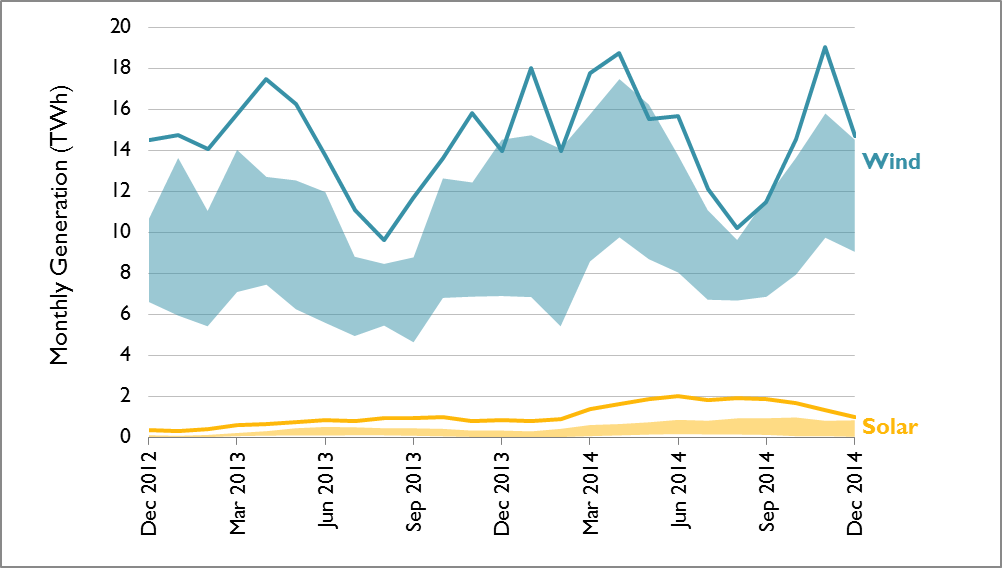
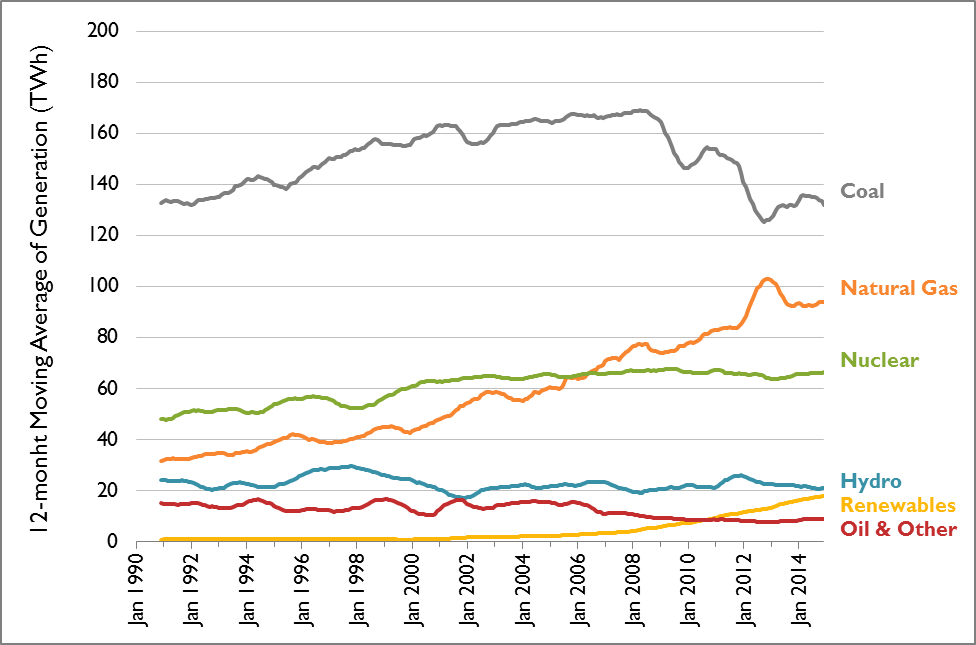
Figure 6 shows a 12-month moving average of monthly generation since January 1990. This figure shows how coal generation leveled off in recent years following the precipitous decrease in coal generation that began in 2010, how natural gas generation has dropped since its 2012 peak, and how renewables are rapidly rising to overtake hydro generation as the fourth largest source of electricity in the United States. In both October and November 2014, renewable generation exceeded hydro generation. (This phenomenon is likely due to a number of factors, including that autumn is typically a low season for hydro generation. Low autumnal hydro generation has likely been exacerbated in recent years by the persistent, widespread drought in the western United States.) By extrapolating the 24-month exponential growth trend in renewable generation, we estimate that renewable generation will permanently overtake hydro generation in late summer/fall 2015.
Figure 6. 12-month moving average of monthly electric generation, 1990-2014.
Over time, the type of generation produced in each state has varied. The animation in Figure 7 below displays how the resource mix of energy generated in each state has varied between 1990 and 2014. States are sorted by the percentage of in-state energy produced using coal in 1990. Over time, the percentage of generation produced in each state has been reduced compared to natural gas and renewables. In 2014, 14 states produced 10 percent or less generation from coal (compared to eight states ten years ago in 2005). In 2014, 11 states produced 10 percent or more generation from renewables (compared to zero states in 2005).
Figure 7. Annual net generation composition by fuel type, by state, 1990-2014.
Emissions
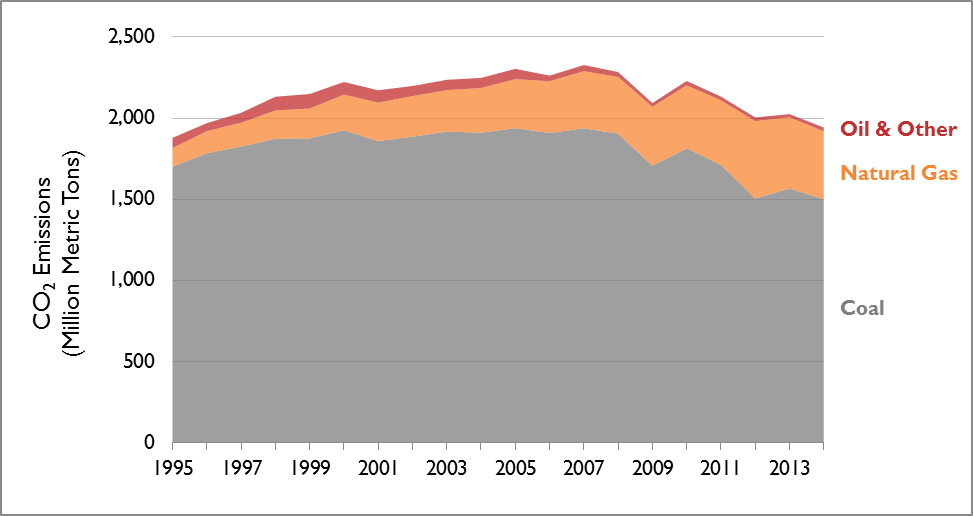
Since hitting an all-time peak in 2007, CO2 emissions have declined to 1,943 million metric tons in 2014, the lowest level emitted since 1996. This trend can be largely attributed to a nationwide switch to lower-emitting generation. Natural gas units emit roughly half the CO2 emissions of coal units per MWh generated. Of 2014 generation that emitted CO2, one-third came from natural gas and two-thirds came from coal. Comparatively, only 20 percent of 2014 CO2 emissions came from natural gas and 80 percent of CO2 emissions came from coal.
Figure 7 indicates the total CO2 emissions by emitting resource (coal, natural, gas, and oil & other) from 1995 to 2014.
Figure 8. CO2 emissions from emitting resources, 1995-2014.
All values in this post are utility-scale and do not include distributed generation (e.g., rooftop PV). All capacity values are from EIA 860 and EIA Electric Power Monthly, 2001-2014. All generation values are from EIA 923, 1999-2014. All CO2 emission values are from EPA Air Markets Program Data, 1995-2014. All 2014 values are preliminary and are subject to future updates and revisions.