Synapse Electricity Snapshot 2016
Today’s electric system looks remarkably different than it looked 10—or even five—years ago. Coal generation is retiring at an unprecedented rate and being replaced by natural gas and renewables. The United States’ wind, solar, and geothermal electric generating capacity now equals capacities from hydroelectric and from nuclear resources. Carbon dioxide (CO2) emissions are at their lowest levels in 20 years, and both total generation and electric sales have remained essentially unchanged for 10 years. The “Synapse Electricity Snapshot 2016” (available here) highlights several major trends in 2015 electric-sector capacity, generation, and CO2 emissions. Key findings include the following:
- Renewable, hydro, and nuclear capacities are now equal. Together, all non-CO2-emitting generating capacity makes up about 30 percent of the nationwide total and accounts for 31 percent of all generation.
- Retirement of old and uneconomic coal plants has led to the lowest level of coal capacity since 1986.
- Annual natural gas generation surpassed coal generation for the last six months of 2015, and came within 1 percent of annual coal generation for the first time in U.S. history.
- Since 2005, annual growth in electric retail sales has averaged just 0.2 percent per year.
- Since hitting an all-time peak in 2007, electric sector CO2 emissions have declined to 1,894 million metric tons in 2015, their lowest level since 1995.
- Since 1990, the total economic value produced for every metric ton of CO2 emitted has increased by 73 percent from $5,500 to $9,500.
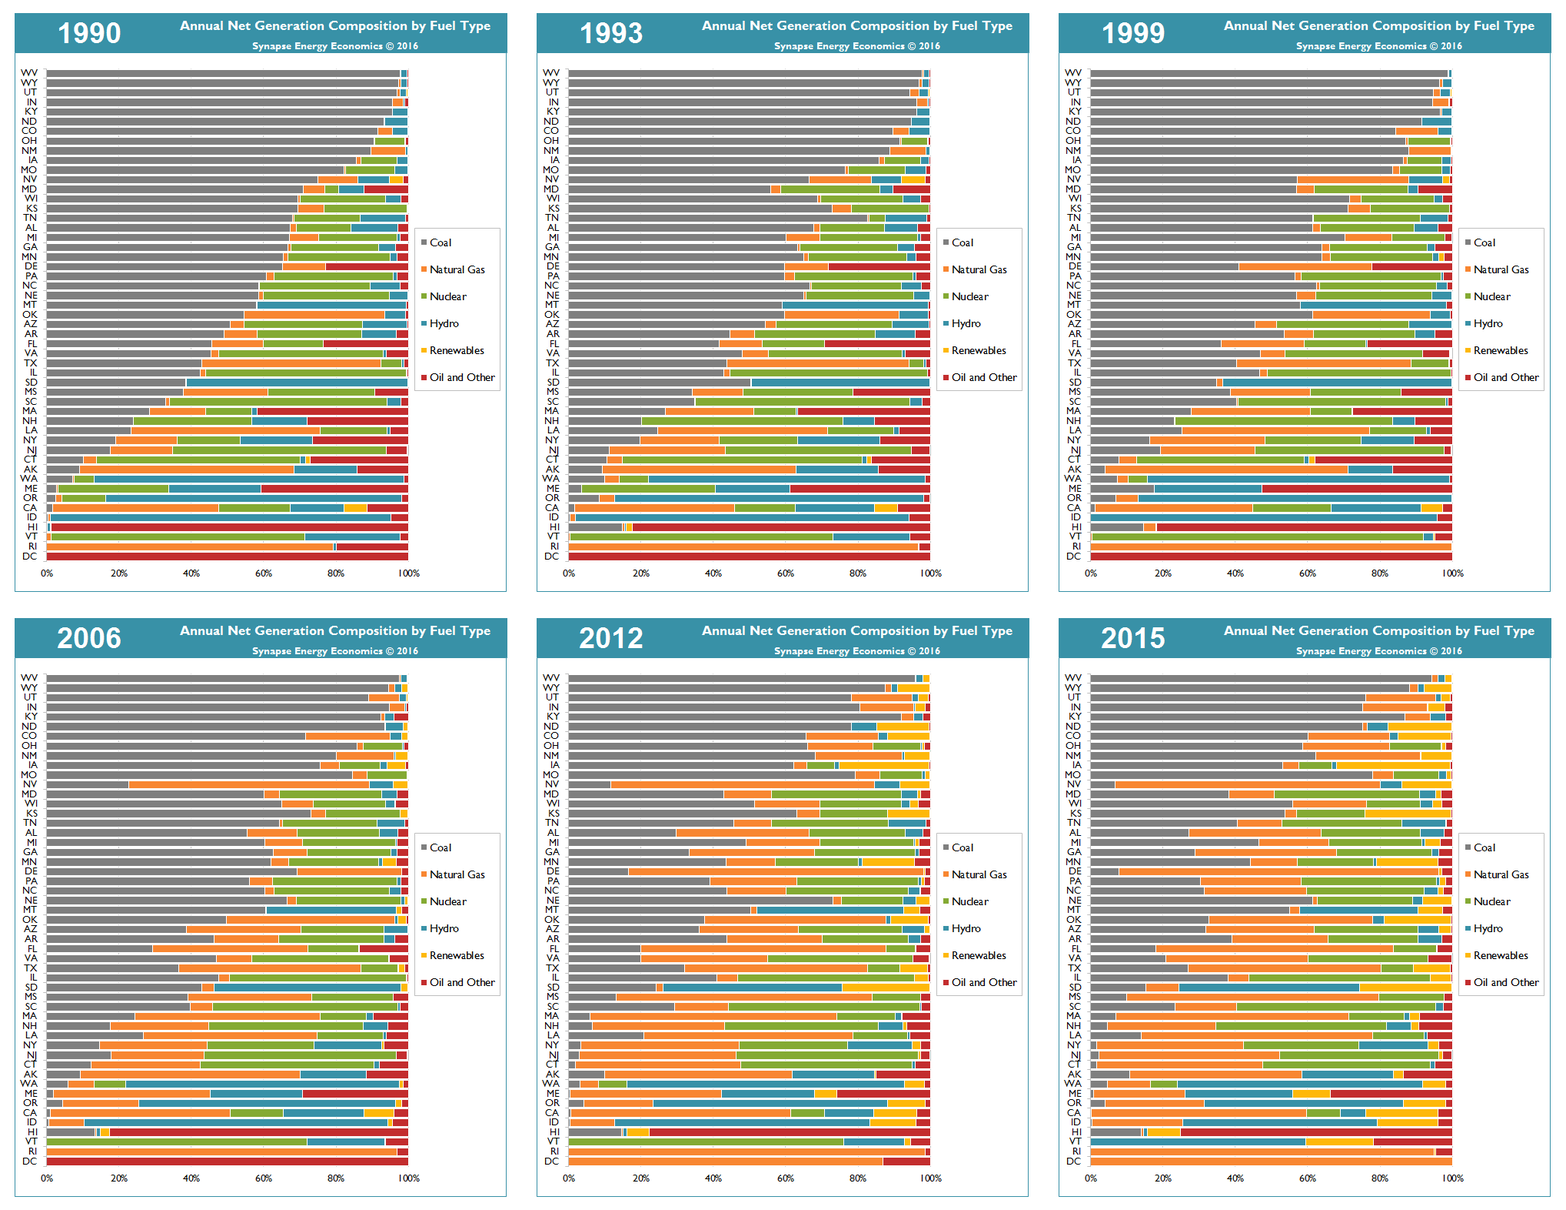
The animation in Figure 1, below, demonstrates how the resource mix of energy generated in each state has varied between 1990 and 2015. Over time, the share of generation from coal has shrunk compared to that of natural gas and renewables (see Table 1). In 2015, 16 states produced 10 percent or less generation from coal (compared to eight states 10 years ago in 2005 and 14 states in 2014). In 2015, 14 states produced 10 percent or more generation from renewables (compared to zero states in 2005 and 11 states in 2014).
Figure 1. Annual net generation composition by fuel type and state, 1990-2015

Note: In this figure, "Renewables" includes wind, solar, and geothermal while "Oil and Other" includes oil, petcoke, biomass, solid waste, landfill gas, tires, purchases, and other miscellaneous fuel types.
Sources: EIA Forms 923, 906, 920, 759, and 867 1990-2015
Table 1. Number of states with low levels of coal or high levels of renewables