AEO 2025 highlights the importance of federal-level electricity policies for reducing CO2 emissions
On April 15th, the U.S. Energy Information Administration (EIA) released the 2025 Annual Energy Outlook (AEO). AEO 2025 contains projections of energy use from the electric power, residential, commercial, industrial, and transportation sectors through 2050, including the impacts of the Inflation Reduction Act (IRA) passed by U.S. Congress in 2022. EIA did not publish an AEO in 2024, as it was in the process of updating the National Energy Modeling System to better incorporate market dynamics and emerging technologies such as hydrogen and carbon capture. The 2025 report’s Reference case is a projection of the future based on estimates of fuel availability, changes in technology costs, and existing legislation. Additional insights into the model will become available over the coming months once EIA publishes full documentation for the 2025 release. Importantly, the report captures the U.S. policy landscape as of December 2024, before the policy shifts that began with the new Trump administration. AEO 2025 projects decreases in U.S. electric sector emissions driven by federal policies such as the IRA and the Clean Air Act 111 rule, though further action will be needed to decarbonize the sector and mitigate climate impacts.
Recent policies drive down projected electric-sector CO2 emissions, but not enough to achieve a carbon-free electric sector
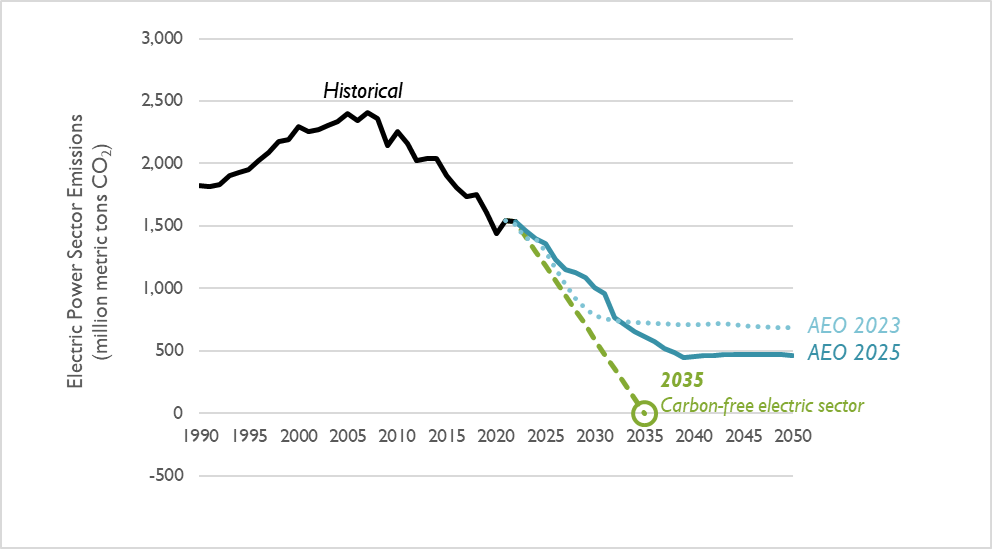
Compared to the previous AEO projection, AEO 2025 shows electric sector carbon dioxide (CO2) emissions reductions getting off to a slow start in the early years before picking up speed: emissions from 2026 to 2032 are 18 percent higher in AEO 2025 (see Figure 1). This early difference may be due to lower projected gas prices or changes to renewable build costs. Starting in 2033, electric sector CO2 emissions fall below AEO 2023 projections as the 111 rule kicks in. AEO 2025 models electric sector CO2 emissions that are 13 percent lower than those modeled in AEO 2023, when looking out through 2050. The Biden Administration had a stated goal of achieving a carbon-free electric sector by 2035. While the IRA can largely achieve reductions aligned with this goal through 2030, meeting that target would require additional policies.
Figure 1. Comparison of electric-sector CO2 emission projections in the AEO 2025 and AEO 2023 Reference cases
Existing Policies Lead to Nearly 1,500 TWh of Wind and Solar by 2030
AEO 2025 projects a ramp up of solar and wind in the late 2020s, followed by a slow-down that coincides with the phase-out of IRA incentives (see Figure 2).
- Wind and solar: With the continuation of the IRA, projections of wind and solar generation accelerate in the mid- to late-2020s. By 2030, EIA projects these two sources will produce almost 1,500 TWh. After the IRA tax credits begin to phase out in the early 2030s, the deployment of renewables grows at a reduced rate. By 2050, EIA projects wind and solar resources will generate over 4,200 TWh.
- Natural gas: EIA projects gas-fueled electricity to flatten in the short term and drop through the early 2030s (falling below wind and solar generation in 2033) before leveling out again around 2035 when the IRA incentives phase out.
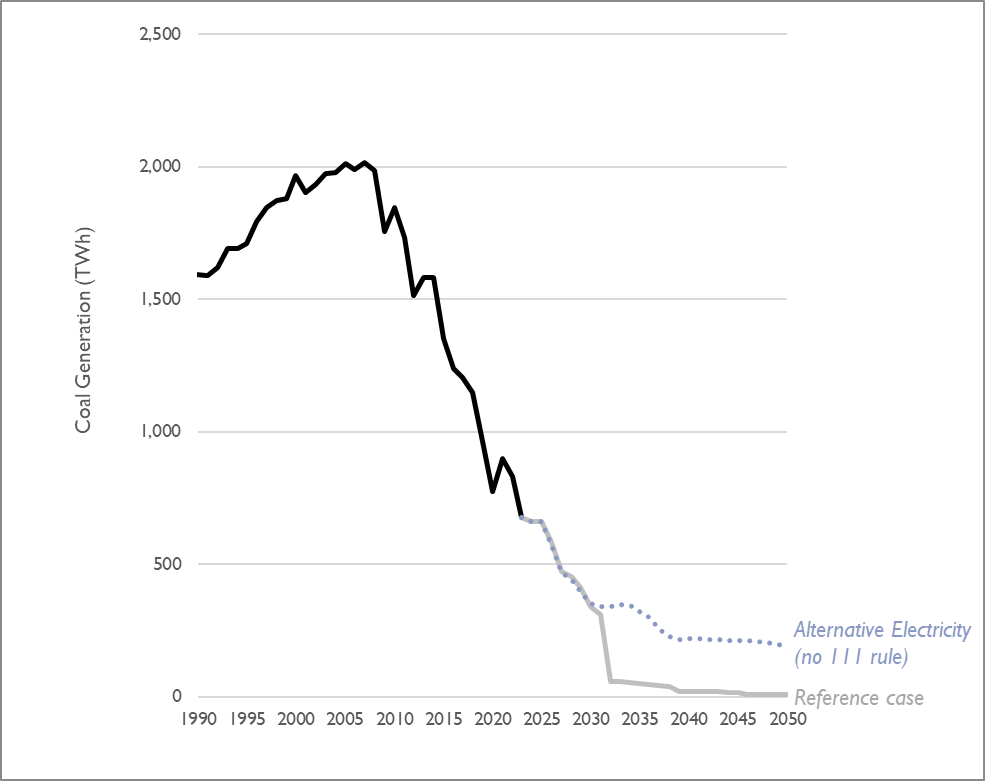
- Coal: EIA projects a sharp decline in coal-fueled generation starting around 2032 due to the 111 rule. This retirement of coal is accompanied by an increase in gas combustion turbine capacity. EIA also models an Alternative Electricity case which assumes the 111 rule does not exist (see Figure 3). Even without the 111 rule, EIA is projecting that coal generation continues to decrease, representing just 3 percent of electricity generation by 2050.
Figure 2. Comparison of electricity generation from coal, natural gas, and wind and solar in the AEO 2025 and AEO 2023 Reference cases (series from AEO 2023 are shown as dotted lines)
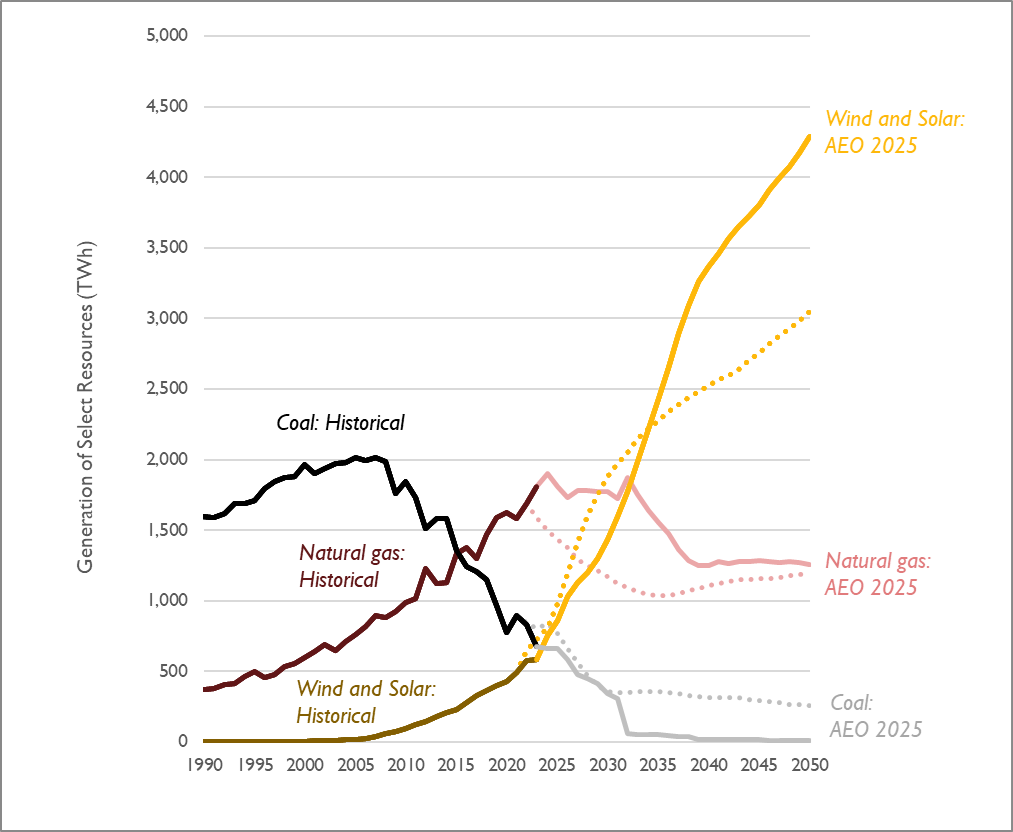
Note: This figure does not include generation from hydro, nuclear, geothermal, biomass, and miscellaneous sources.
Figure 3. Comparison of coal generation with (Reference case) and without (Alternative Electricity case) 111 rule
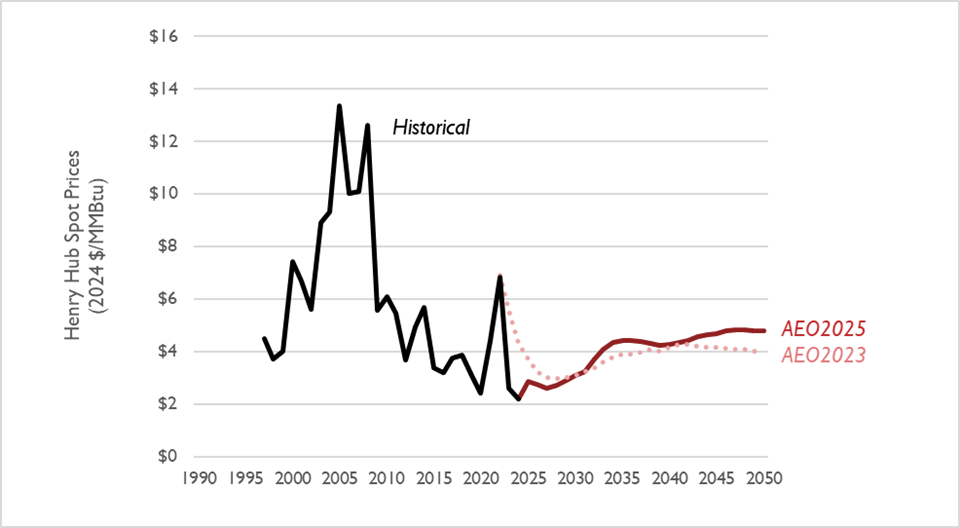
Near-term trends in natural gas and coal generation are driven in part by the dynamics of the latest AEO’s natural gas price projection (see Figure 4). AEO 2025 reflects the near-historically low gas prices experienced in 2024. Gas prices are projected to rise again in the late 2030s, in line with a gradual increase in natural gas generation. Compared to AEO 2023, AEO 2025 models lower gas prices in the near term and higher gas prices in the long term. We also observe an increase in prices in the early 2030s as liquified natural gas export demand increases, followed by a decrease in the second half of the decade as production likely catches up.
Figure 4. Comparison of natural gas prices at the Henry Hub in the AEO 2025 and AEO 2023 Reference cases
AEO 2025 takes a more robust look at future load from data centers and transportation electrification
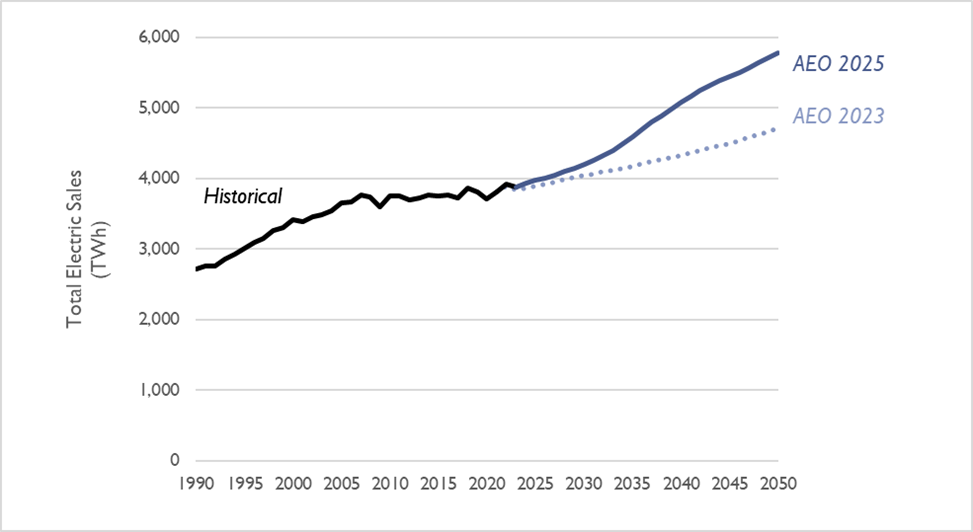
Aggregated electricity generation from coal, natural gas, renewables, and other resources in AEO 2025 are much higher compared to the previous projection (see Figure 5). The increase in electric sales between 2024 and 2050 is 117 percent larger in AEO 2025 relative to AEO 2023. This is likely due to increases in projected load from data centers and electrification (particularly electric vehicles). AEO 2025 includes expanded data center representation and changes to how the modeling treats electric vehicle (EV) charging (Note: EV charging was previously categorized under the Transportation sector but is now split between Residential and Commercial). We note this is the first time in seven AEO releases that the EIA’s projection of load has substantially changed.
Figure 5. Comparison of electricity sales projections in the AEO 2025 and AEO 2023 Reference cases
Compared to AEO 2023, AEO 2025 projects more EVs and fewer non-electric trucks on the road in 2030, 2040, and 2050. Unlike the previous outlook, AEO 2025 includes EPA’s vehicle tailpipe emission standards for model years 2027 to 2032 and California Air Resource Board’s zero-emission vehicle sale mandates. Even with the increased EV projections, the number of EVs modeled in AEO 2025 is a considerably lower projection than found in other sources. For example, while EIA projects that under 3 percent of light-duty vehicle sales will be electric in 2027, BloombergNEF’s 2024 Electric Vehicle Outlook estimates that EVs will make up a 48 percent share of light-duty vehicle sales in 2027.
Figure 6. Light-duty vehicle stock in the AEO 2025 and AEO 2023 Reference cases
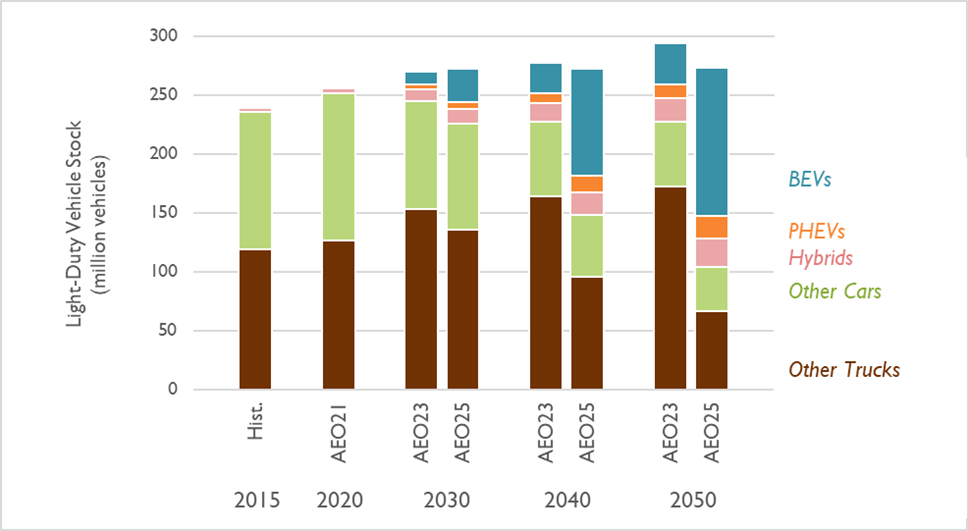
Note: BEVs includes all-electric vehicles. PHEVs includes plug-in hybrids, while Hybrids constitutes non-plug-in hybrids. All other alternative light-duty vehicles are included in Other Cars and Other Trucks.
Emissions from all sectors continue to exceed the limit needed to avert catastrophic climate change
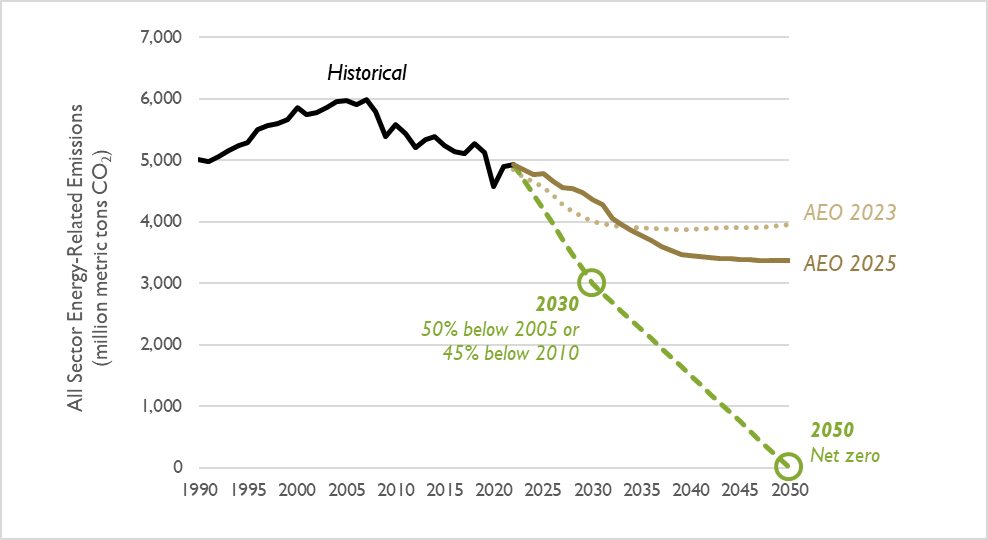
According to the Intergovernmental Panel on Climate Change (IPCC), economy-wide greenhouse gas emissions must decrease by 50 percent by 2030 and be eliminated altogether by 2050 to avert catastrophic climate change. The AEO 2025 Reference case shows the dramatic impacts of the IRA and other policies on the electric sector; but it also highlights that without further policies electric sector emission reductions stagnate post-2030, and other sectors are unlikely to see any emission reductions. As a result, the quantity of emissions projected in AEO 2025 substantially exceeds the lower levels of emissions needed to achieve climate targets (see Figure 7).
Figure 7. Comparison of all-sector CO2 emission projections in the AEO 2025 and AEO 2023 Reference cases, relative to the level needed to avert catastrophic climate change (shown on this chart as a dashed line)
Compared to the previous report, AEO 2025 projects higher energy-related emissions in the near term and lower emissions in the long term. This aligns with the electric sector trend described above. Figure 8 shows a breakdown of emissions by sector. Across all sectors, AEO 2025 projects higher emissions in 2030 and lower emissions in 2040 and 2050, when the clean energy transition is expected to be underway.
Figure 8. Emissions by sector
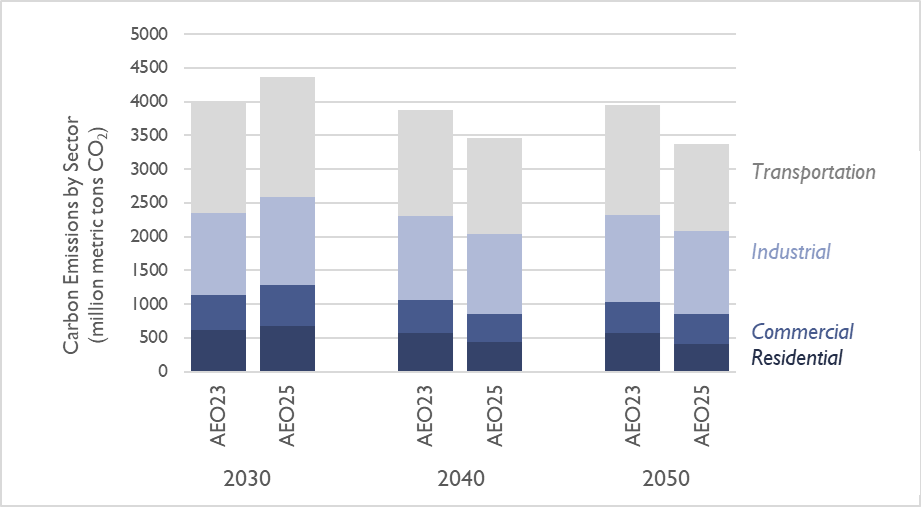
Note: This figure allocates electric sector emissions to each of the other sectors.