Annual Energy Outlook 2023 Shows Gap Following the IRA's Electric Sector Impacts

On March 16th the U.S. Energy Information Administration (EIA) released the 2023 Annual Energy Outlook (AEO). AEO 2023 contains projections of energy use from the electric power, residential, commercial, industrial, and transportation sectors through 2050, including the impacts of the Inflation Reduction Act (IRA), passed by U.S. Congress last summer. The report’s Reference case is a projection of the future based on estimates of fuel availability, changes in technology costs, and current legislation. AEO 2023 demonstrates the major changes that the IRA will have on the U.S. electric sector, and that further policies will be needed to drive economy-wide emissions lower through 2050.
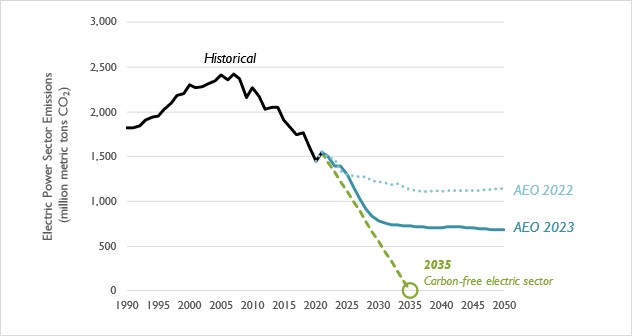
Projection of electric-sector CO2 emissions is relatively unchanged
Compared to last year’s AEO projection, electric sector carbon dioxide (CO2) emissions are 13 percent lower in AEO 2023, when looking at the entirety of CO2 emitted between 2022 (which is a modeled year in both AEOs, as actual data is not yet available) and 2030 (see Figure 1). Because emissions are sustained at new, lower levels, and because of a lack of policies to drive emissions even lower after the IRA ends in the early 2030s, AEO 2023 models electric sector CO2 emissions that are 29 percent lower than was modeled in AEO 2023, when looking out through 2050. The Biden Administration has a stated goal of achieving a carbon-free electric sector by 2035; while the IRA is able to largely achieve reductions aligned with this goal through 2030, its expected expiration means that the 2035 goal is not met.
Figure 1. Comparison of electric-sector CO2 emission projections in the AEO 2023 and 2022 Reference case
The IRA Leads to Nearly 1,900 TWh of Wind and Solar by 2030
Compared to AEO 2022, AEO 2023 projects a tremendous increase in the amount of electricity generated from wind and solar, and a correspondingly large decrease in the generation coming from coal and natural gas (see Figure 2).
- Wind and solar: As a result of the IRA, projections of wind and solar generation accelerate in the mid- to late-2020s, compared to AEO 2022. By 2030, AEO 2023 projects almost 1,900 TWh produced from these two sources. After the IRA is modeled as expiring in the early 2030s, the rapid deployment of renewables continues to grow, albeit at a reduced rate. By 2050, over 3,000 TWh are projected to be generated from wind and solar resources.
- Natural gas: EIA projects a short-term increase in natural gas generation that fades as more renewables come online. Natural gas generation drops through the 2020s and 2030s (falling below wind and solar generation in the late 2020s) before it begins to rise again in the mid-2030s to 2040s. This rise is in line with the slowing momentum of renewable builds, post-IRA expiration. This is in stark contrast to the trend projected in AEO 2022, which forecasted a mostly flat trend for natural gas generation in the near term.
- Coal: EIA projects that a gradual decline in coal generation in the near term, with the gradual-ness of this decline likely supported by higher near-term natural gas prices (see Figure 3). After wind and solar generation exceed coal generation in 2025, coal generation declines precipitously in the mid-2020s, in part due to announced coal plant retirements. As the IRA expires, the decline in coal generation slows.
Figure 2: Comparison of electricity generation from coal, natural gas, and wind and solar in the AEO 2022 Reference cases (series from AEO 2022 are shown as dotted lines)
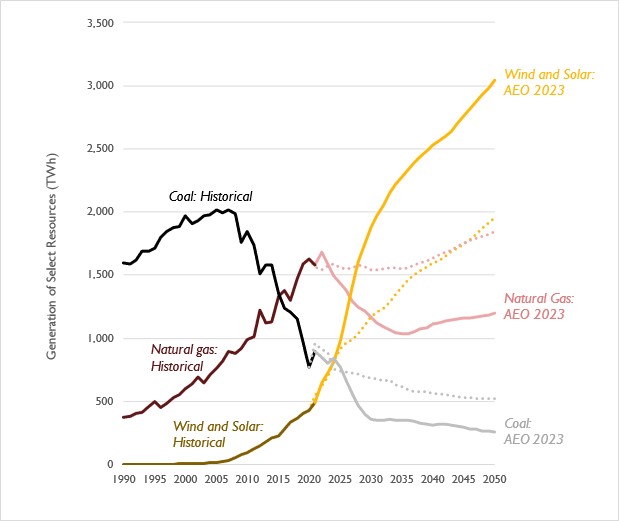
Note: Generation from hydro, nuclear, geothermal, biomass, and miscellaneous sources are not included in this figure.
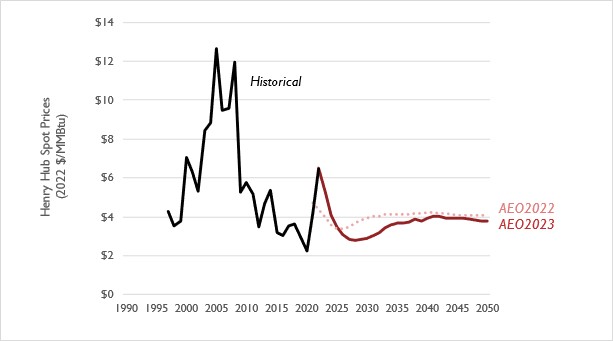
Near-term trends in natural gas and coal generation are driven in part by the dynamics of the latest AEO’s natural gas price projection (see Figure 3). AEO 2023 reflects the higher natural gas prices being experienced today, which then decline to near-historical lows in the late 2020s. Gas prices then rise again in the late 2030s, in line with a gradual increase in natural gas generation. Compared to AEO 2022, AEO 2023 models much higher gas prices in the near term, lower gas prices in the mid-term (mid-2020s through late 2030s), and overall similar gas prices in the long term.
Figure 3. Comparison of natural gas prices at the Henry Hub in the AEO 2023 and AEO 2022 Reference cases
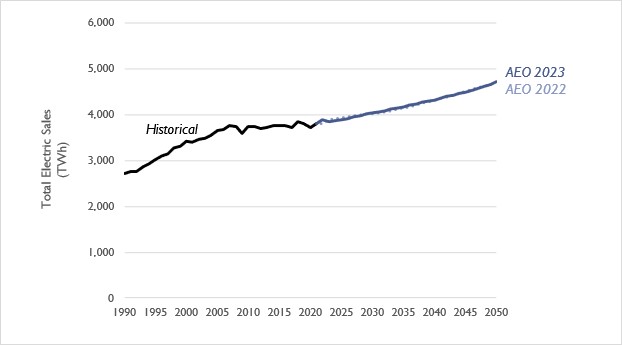
Aggregated electricity generation from coal, natural gas, renewables, and other resources in AEO 2023 are virtually unchanged compared to last year’s projection (see Figure 4). EIA’s projection finds that the provisions of the IRA aimed at electrification of vehicles and buildings does not appear to have a substantial impact on the deployment of these technologies, relative to what was modeled in AEO 2022.
Figure 4. Comparison of electricity sales projections in the AEO 2023 and AEO 2022 Reference cases
EIA projects slightly greater EV deployment in AEO 2023
Compared to AEO 2022, AEO 2023 projects slightly more electric vehicles (EV) on the road in 2030 and 2050. This increase is in part reflective of the new incentives for EVs embedded in the IRA. However, as in past AEO studies, the number of EVs modeled in AEO 2023 is a considerably lower projection than found in other sources. For example, while AEO projects that 2 percent of light-duty vehicle sales will be electric in 2026, EPA’s December 2021 projection of impacts from the latest CAFE standards estimates that PHEVs and BEVs will combine for an 18 percent share of light-duty vehicle sales in 2026.
Figure 5. Light-duty vehicle stock in the AEO 2023 and 2022 Reference cases
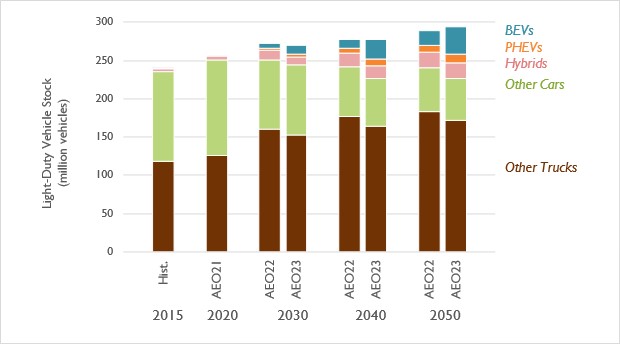
Note: BEVs includes all-electric vehicles. PHEVs includes plug-in hybrids, while Hybrids constitutes non-plug-in hybrids. All other alternative light-duty vehicles are included in Other Cars and Other Trucks.
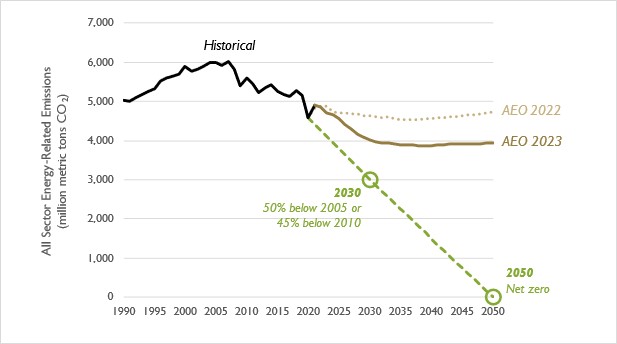
The IRA reduced electric sector emissions, but emissions from all sectors continue to exceed the limit needed to avert catastrophic climate change
According to the Biden Administration and the Intergovernmental Panel on Climate Change (IPCC), economy-wide greenhouse gas emissions must decrease by 50 percent by 2030 and be eliminated altogether by 2050 to avert catastrophic climate change. The AEO 2023 Reference case shows the dramatic impacts of the IRA on the electric sector. But it also highlights that without further policies electric sector emission reductions stagnate post-2030, and other sectors are unlikely to see any emission reductions. As a result, the quantity of emissions projected in AEO 2023 substantially exceeds the lower levels of emissions needed to achieve climate targets (see Figure 6).
Figure 6. Comparison of all-sector CO2 emission projections in the AEO 2023 and 2022 Reference cases, relative to the level needed to avert catastrophic climate change (shown on this chart as a dashed line)