Justice40: The Complicated Business of Defining Disadvantaged Communities
This blog post, originally posted on August 19, 2022, compares the CEQ and DOE definitions of disadvantaged communities. Executive Order 14008 was rescinded on January 20, 2025 and these definitions and spatial mapping tools have been taken down. An unofficial copy of the CEJST tool is available on the Public Environmental Data Project’s website.
In 2021, the Biden Administration established the Justice40 Initiative, which committed to allocating 40 percent of some federal investments to disadvantaged communities. This announcement has spurred discussion on how to best define these communities. In Executive Order 14008, the White House Council on Environmental Quality (CEQ) was directed to create a geospatial Climate and Economic Justice Screening Tool to identify such disadvantaged communities. CEQ released the beta version of the tool in February of 2022 and is currently revising it following a 90-day comment period. During this time, agencies may develop their own indicators and definitions appropriate for their programs. Thus, in early 2022, the U.S. Department of Energy (DOE) created its own definition and corresponding spatial tool, the Disadvantaged Communities Reporter. These two tools are currently the only national-level definitions of disadvantaged communities (DAC) that include environmental hazards as indicators. While both of these two tools appear to be supported by the federal government, they could have critical differences that could impact which communities benefit—or don’t benefit—from federal policies and investments.
Comparing federal definitions of disadvantaged communities
The CEQ and DOE approaches each use different methods and indicators to determine if a census tract qualifies as a disadvantaged community. First, under CEQ’s definition, DACs are identified through a threshold method. There are eight different environmental categories, each with various indicators that determine if a category is met and a ninth socioeconomic category. To be identified as a DAC, a census tract must meet the socioeconomic criteria, and at least one of the eight environmental categories. To meet an indicator within an environmental category, the census tract must be at or above the 90th percentile in the United States. To meet the socioeconomic indicators, the census tract must be at or above the 65th percentile for the low-income indicator and have no more than 20 percent of its population enrolled in higher education (this is to prevent census tracts in which many college students have low or no income from qualifying as DACs). The low-income indicator is represented by the percentage of households in the census tract that have an income at or below 200 percent of the federal poverty line. Under CEQ’s definition, 23,000 census tracts meet the criteria as DACs, covering 28 percent of Americans.
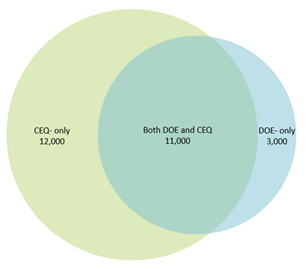
Meanwhile, DOE uses a different kind of indexing-and-threshold method that calculates a “cumulative burden score” for each tract from 36 indicators. The cumulative burden score is the sum of each percentile across the indicators, with each indicator weighted equally. Next, the method identifies within each state the 20 percent most burdened census tracts that also meet DOE’s high-poverty indicator. To be classified as a DAC, the census tract must have at least 30 percent of households at or below 200 percent of the federal poverty level or make 80 percent of the area median income. This means that a census tract with a high cumulative burden will not be a DAC if it doesn’t pass the socioeconomic threshold for that state, but a census tract with an equivalent cumulative burden in a different state with a different socioeconomic threshold might qualify as a DAC. Under DOE’s definition, 14,000 census tracts qualify as DACs, covering 20 percent of Americans. 11,000 of these DOE DACs overlap with CEQ DACs; an additional 3,000 DACs are identified by DOE only and 12,000 DACs are identified by CEQ only (see Figure 1 below).
Figure 1. Number of census tracts qualifying as disadvantaged communities nationwide under CEQ and DOE definitions
One key difference between the two methodologies is that the hypothetical inclusion of an additional criterion in the CEQ definition would only identify more census tracts as DACs and would not remove any other census tracts from qualifying as DACs. In contrast, such an addition to DOE’s definition could cause a reshuffling of census tracts. This is important because some indicators may not be applicable to certain census tracts. For example, in Alaska, where there is little to no agriculture, the agricultural loss rate indicator is not relevant to a census tract. Under CEQ’s methodology, this does not hurt that tract’s chances of becoming a DAC. However, if agricultural loss rate was an indicator in DOE’s definition, it would lower that tract’s cumulative burden score and lower its chances of qualifying as a DAC.
A second difference is how each definition treats tracts in tribal lands and U.S. territories. Under CEQ’s current approach, these census tracts are subject to the same definition as all other census tracts. Often, these census tracts have less available data, and thus, have fewer “opportunities” to be considered DACs. In contrast, DOE’s definition automatically categorizes all tribal lands and U.S. territories as DACs.
A question of race
As noted in many articles and analyses, neither CEQ’s nor DOE’s list of indicators includes race. CEQ's exclusion of race appears to be a deliberate effort to survive judicial review, though it complicates alignment with the White House Environmental Justice Advisory Council's (WHEJAC) recommendations. Whatever the reason, this is a notable omission in a pair of tools intended to help identify communities that have been historically marginalized, underserved, and overburdened by pollution. According to one EPA study, "all emission sectors cause disproportionate exposures for people of color on average… [Furthermore,] because of a legacy of housing policy and other factors, racial-ethnic exposure disparities continue to persist even with a decrease in the overall exposure." The effects of racial inequality on environmental inequities have been known for decades and will continue to persist unless policymakers take action. Another study conducted by Dr. Paul Mohai of University of Michigan and Dr. Robin Saha of the University of Montana, finds that “racial disparities around hazardous waste facilities… persist even when controlling for economic and sociopolitical variables, suggesting that factors uniquely associated with race, such as racial targeting, housing discrimination, or other race-related factors are associated with the location of the nation’s hazardous waste facilities.”
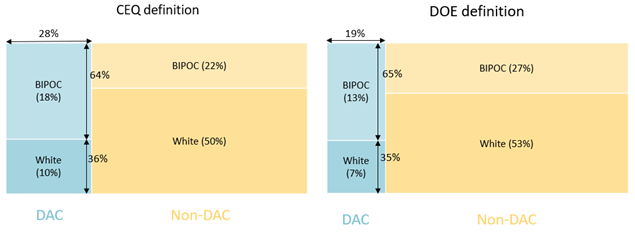
Using data from the U.S. Census, we explored the impacts of excluding race by examining the overlap between DACs under both definitions, and how people living in census tracts identify themselves. The CEQ definition of DACs shows 28 percent of the population living in a DAC. Of that population, 64 percent identifies as Black, Indigenous, or person of color (BIPOC). Meanwhile, under DOE’s definition, a smaller share of the total population lives in DACs (19 percent), with a similar share of those (65 percent) identifying as BIPOC (see Figure 2).
Figure 2. Population identifying as BIPOC in DACs and other communities under each DAC definition
We also found that while there is substantial overlap between DACs as defined under both definitions and majority BIPOC census tracts, neither definition includes all the census tracts that are majority BIPOC. Under the CEQ definition, about 9,000 census tracts (containing 22 percent of the BIPOC population in the United States) have a majority BIPOC population and are not defined as DAC. Similarly, under the CEQ definition, about 14,000 census tracts (containing 27 percent of the BIPOC population) have a majority BIPOC population and are not defined as DAC. Thus, if race was included as an indicator by each definition, and if a threshold of 50 percent was used, an additional 22 percent and 27 percent of people would be included in DACs in the CEQ and DOE definitions, respectively.
Based on historical evidence, many believe that race is a crucial indicator that should be included in definitions of disadvantaged communities if the goal of Justice40 is to address both current environmental hazards and legacy damage. According to the Conservation Law Foundation, using race as a criterion in designating environmental justice populations “…meets constitutional standards as set forth by the Supreme Court of the United States.”
When the final version of CEQ’s tool is released, all agencies will be required to use that definition. The inclusion (or exclusion) of race in the CEQ, as well as the definition’s potential adoption of some of the indicators and advantages of DOE’s methodology, will greatly affect which census tracts will be considered as disadvantaged communities and receive benefits from the Justice40 initiative.