Same Old Colossal Emissions Target Gap in This Year's Annual Energy Outlook
On March 3rd the U.S. Energy Information Administration (EIA) released the 2022 Annual Energy Outlook (AEO). AEO 2022 contains projections of energy use from the electric power, residential, commercial, industrial, and transportation sectors through 2050. The report’s Reference case is a projection of the future based on estimates of fuel availability, changes in technology costs, and current legislation. Overall, AEO 2022 shows only minor changes in projections of energy use and emissions compared to AEO 2021. Here's a breakdown of the EIA's projections:
Projection of electric-sector CO2 emissions is relatively unchanged
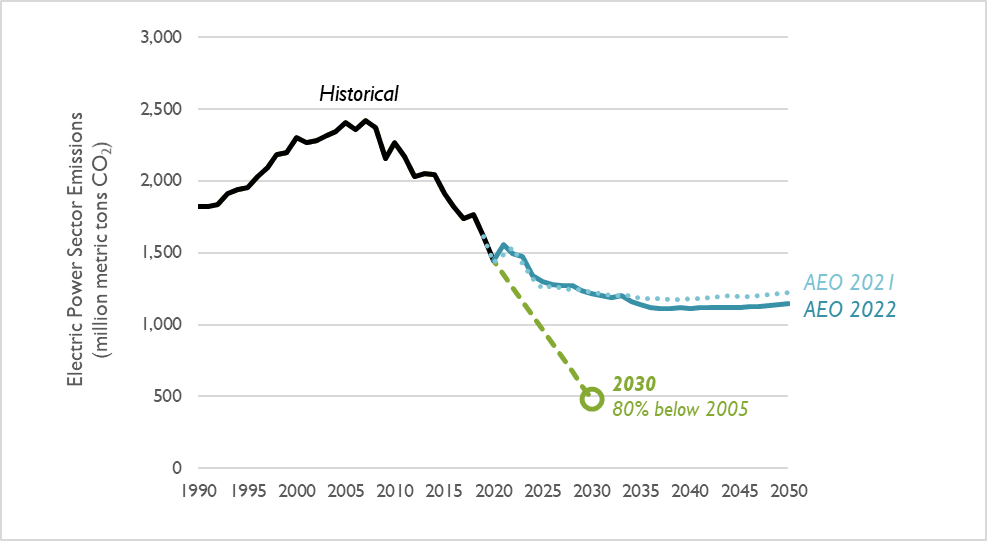
Compared to last year’s AEO projection, electric sector carbon dioxide (CO2) emissions are 1 percent higher in AEO 2022, when looking at the entirety of CO2 emitted between 2021 (which is a modeled year in both AEOs, as actual data is not yet aggregated) and 2030 (see Figure 1). AEO 2022 models slightly lower emissions through the farther future: over the 2021–2050 period, AEO 2022’s electric sector CO2 emissions are 3 percent lower than was modeled in AEO 2021. Recent goals laid out in the languishing Build Back Better bill call for an 80 percent reduction in power sector emissions by 2030. AEO 2022’s Reference case instead shows power sector emissions exceeding this target by 730 million metric tons in 2030.
Figure 1. Comparison of electric-sector CO2 emission projections in the AEO 2022 and 2021 Reference case
Generation projections: fossil fuel generation enjoys a near-term boost, but it doesn’t last
Compared to AEO 2021, AEO 2022 projects sustained generation from natural gas generation. This is echoed by a near-term increase in coal generation, which is slightly smaller than last year’s projection (see Figure 2).
- Coal: EIA’s latest near-term projection of coal generation is very similar to AEO 2021. Coal generation is expected to rebound to 2019 levels for several years while gas prices remain high (see Figure 3), then fall to 2020 levels in 2024 as gas prices fall back to about $3 per MMBtu and coal retirements increase. Coal generation then steadily declines through 2050.
- Natural gas: In the near term, EIA projects essentially flat levels of natural gas generation through the late 2030s. Gas generation then climbs to a peak of about 1,850 TWh in 2050.
- Wind and solar: Projections of wind and solar generation in AEO 2022 are similar to last year’s projections. Generation from wind and solar is projected to exceed coal generation in 2024. For the first time, AEO is projecting a Reference case where wind and solar generation exceed natural gas generation, although this is not projected to occur until 2046. While AEO 2022 projects larger quantities of solar generation throughout the study period, compared to AEO 2021, generation from wind is considerably lower. AEO projections often project a “flattening” of wind additions as the production tax credit phases out, but AEO 2022 differs by showing even less wind added through the mid-2020s.In 2030, non-emitting generation (including generation from wind, solar, hydro, and nuclear) provides 50 percent of the total generation nationwide. This falls short of recent calls for an 80 percent non-emitting generation by 2030.
Figure 2. Comparison of electricity generation from coal, natural gas, and wind and solar in the AEO 2022 and AEO 2021 Reference cases (series from AEO 2021 are shown as dotted lines)
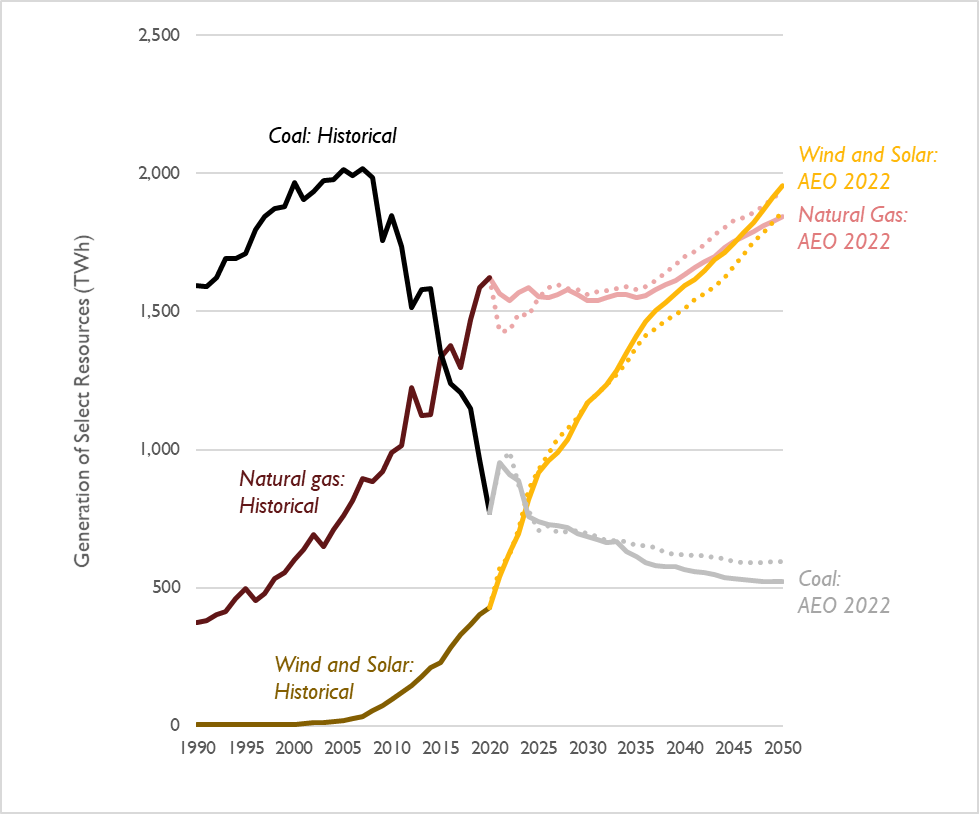
Note: Generation of hydro, nuclear, geothermal, biomass, and miscellaneous sources are not included in this figure.
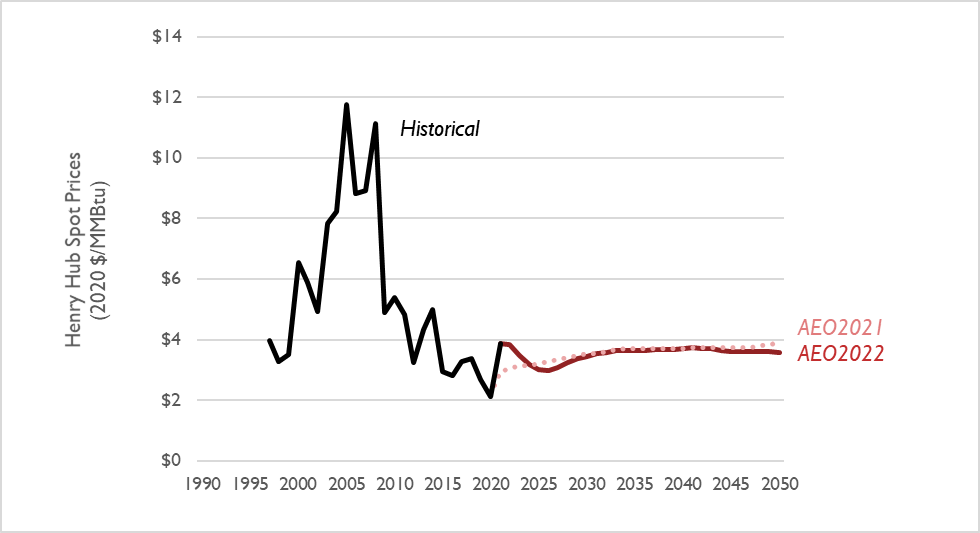
The shifts in natural gas and coal generation are driven in part by the dynamics of the latest AEO’s natural gas price projection (see Figure 3). Compared to AEO 2021, AEO 2022 projects much higher gas prices through 2023. However, prices are projected to drop to the same levels in 2024 and are projected to be even lower in the late 2020s. Gas prices are then for both 2021 and 2022 in the two projections through 2050.
Figure 3. Comparison of natural gas prices at the Henry Hub in the AEO 2022 and AEO 2021 Reference cases
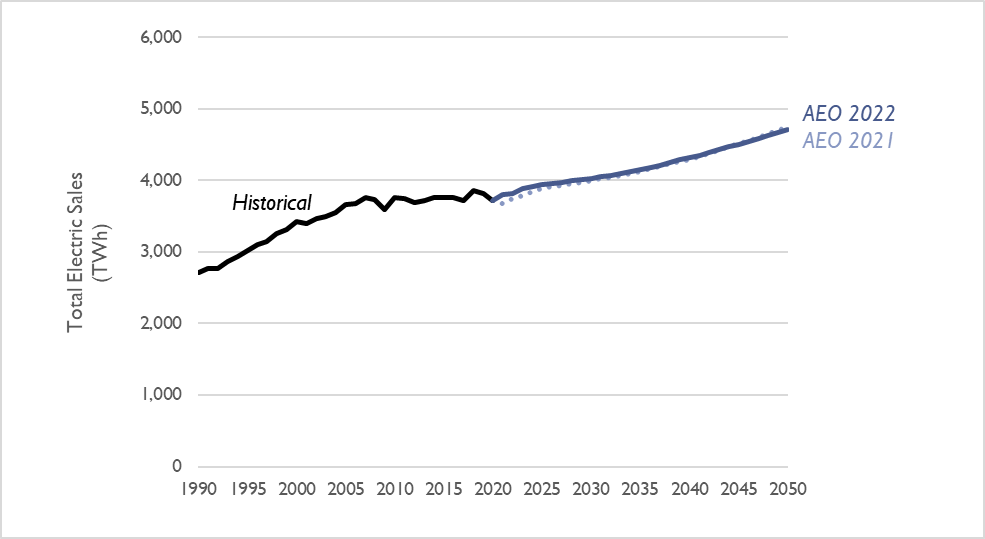
Aggregated electricity generation from coal, natural gas, renewables, and other resources in AEO 2022 is virtually unchanged compared to last year’s projection. This is because EIA has not significantly revised its projection for electricity sales in several years, except for some minor changes in the very near term due to economic slowdown resulting from the COVID-19 pandemic (see Figure 4). Between 2021 and 2030, projected electricity sales are, on average, 1 percent higher per year relative to AEO 2021.
Figure 4. Comparison of electricity sales projections in AEO 2022 and AEO 2021 Reference cases
EIA projects a minor increase in the share of electric vehicles through 2050—EPA's projection is significantly higher
Compared to AEO 2021, AEO 2022 projects a 3 percent increase in the number of vehicles on the road in 2030, which grows to a 5 percent spread in 2050. Echoing a trend from previous years, AEO 2022 models that light-duty vehicles are increasingly “light trucks” rather than “cars.” However, the differences between these two categories are becoming increasingly blurred, with the majority of both categories being made up of crossover vehicles of various sizes by 2030.
As in previous years, AEO projects only a small number of electric vehicles (EV) on the road in future years. That being said, EIA’s projection of the share of vehicles that are electric has increased slightly, relative to AEO 2021 (climbing from 5 to 8 percent in 2030). This is a considerably lower projection than found in other sources. For example, while AEO projects that 2 percent of light-duty vehicle sales will be electric in 2026, EPA’s projection of impacts from the latest CAFE standards estimates that PHEVs and BEVs will combine for an 18 percent share of light-duty vehicle sales in 2026.
Figure 5. Light-duty vehicle stock in the AEO 2022 and 2021 Reference cases
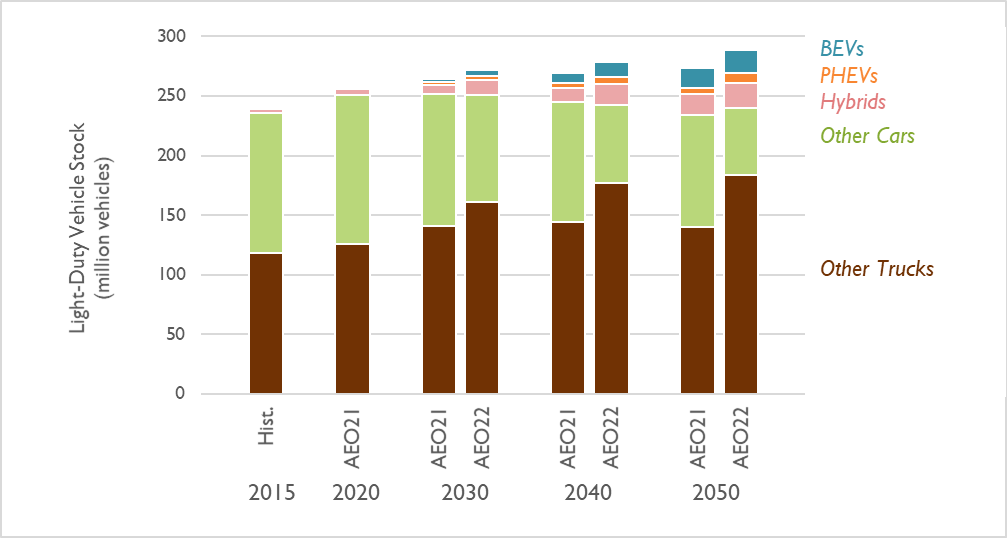
Note: BEVs include all-electric vehicles. PHEVs include plug-in hybrids, while Hybrids constitute non-plug-in hybrids. All other alternative light-duty vehicles are included in Other Cars and Other Trucks.
Emissions from all sectors continue to exceed the limit needed to avert catastrophic climate change
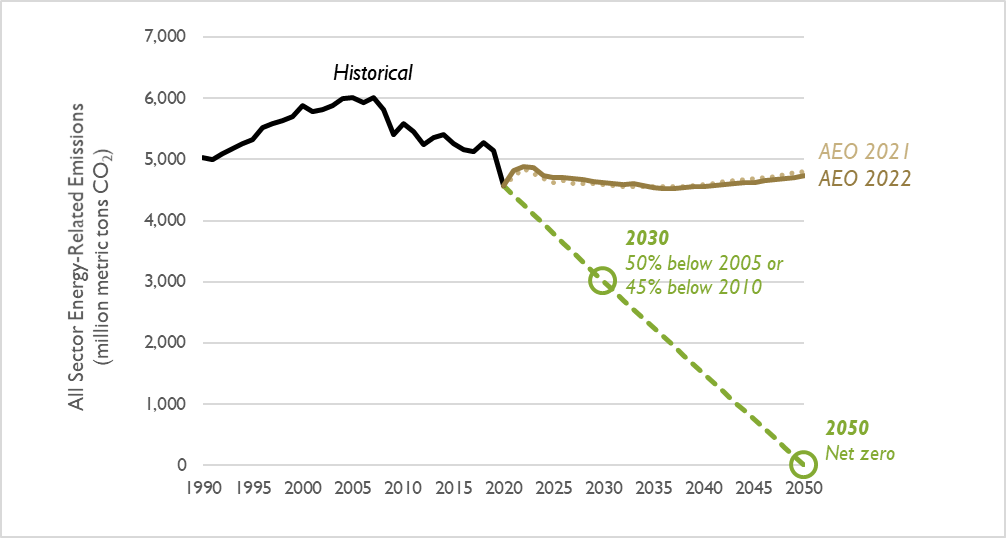
According to the Biden Administration and the Intergovernmental Panel on Climate Change (IPCC), economy-wide greenhouse gas emissions must decrease by 50 percent by 2030 and be eliminated altogether by 2050 to avert catastrophic climate change. The AEO 2022 Reference case features a projection of economy-wide emissions that is virtually unchanged from AEO 2021, with emissions increasing in the near term, then holding steady through 2050. The quantity of emissions projected in AEO 2022 substantially exceeds the lower levels of emissions needed to achieve these targets (see Figure 6).
Figure 6. Comparison of all-sector CO2 emission projections in the AEO 2022 and 2021 Reference cases, relative to the level needed to avert catastrophic climate change (shown on this chart as a dashed line)