Synapse Electricity Snapshot 2020
Today’s electric system is almost unrecognizable from the electric system just a decade ago. Generation from natural gas and renewables has accelerated to replace the rapid and unprecedented retirement of coal-fired generators. Wind, solar, and geothermal electric generating capacity in the United States has now eclipsed capacities from hydroelectric and nuclear resources combined. Carbon dioxide (CO2) emissions have reached their lowest levels since 1984. Meanwhile, both total generation and electric sales have only marginally increased over 10 years. The “Synapse Electricity Snapshot 2020” (available here) highlights several major trends in 2019 electric sector capacity, generation, CO2 emissions, and related statistics. Our key findings include the following:
- Renewable capacity (wind, solar, and geothermal) is now at 147 gigawatts (GW), exceeding both hydro and nuclear capacity. Renewables are now the third-largest resource on a capacity basis, behind natural gas and coal. Together, non-CO2-emitting generating capacity makes up 29 percent of the nationwide total and accounts for 36 percent of all generation.
- Retirement of old and uneconomic coal plants has led to the lowest level of coal capacity since 1976.
- Just as in 2018, in 2019, natural gas generation surpassed coal generation in every month.
- Except for March, every month in 2019 set a record for the lowest level of observed monthly coal generation since the late 1970s. For the first time since the late 1970s, coal generation dropped below 1,000 TWh per year. For the first time since at least the 1940s, coal made up less than 25% of nationwide electricity generation.
- Since 2010, annual growth in electric retail sales has averaged 0.4 percent per year.
- Since hitting an all-time peak in 2007, electric sector CO2 emissions have declined to 1,611 million metric tons in 2019, their lowest level since 1984. Electric sector CO2 emissions are now below 1990 levels.
- Since 1990, the amount of CO2 emitted per dollar of GDP has decreased by 56 percent from 0.17 to 0.08 kg per dollar.
- In 2019, electric vehicles made up 1.9 percent of all light-duty vehicle sales.
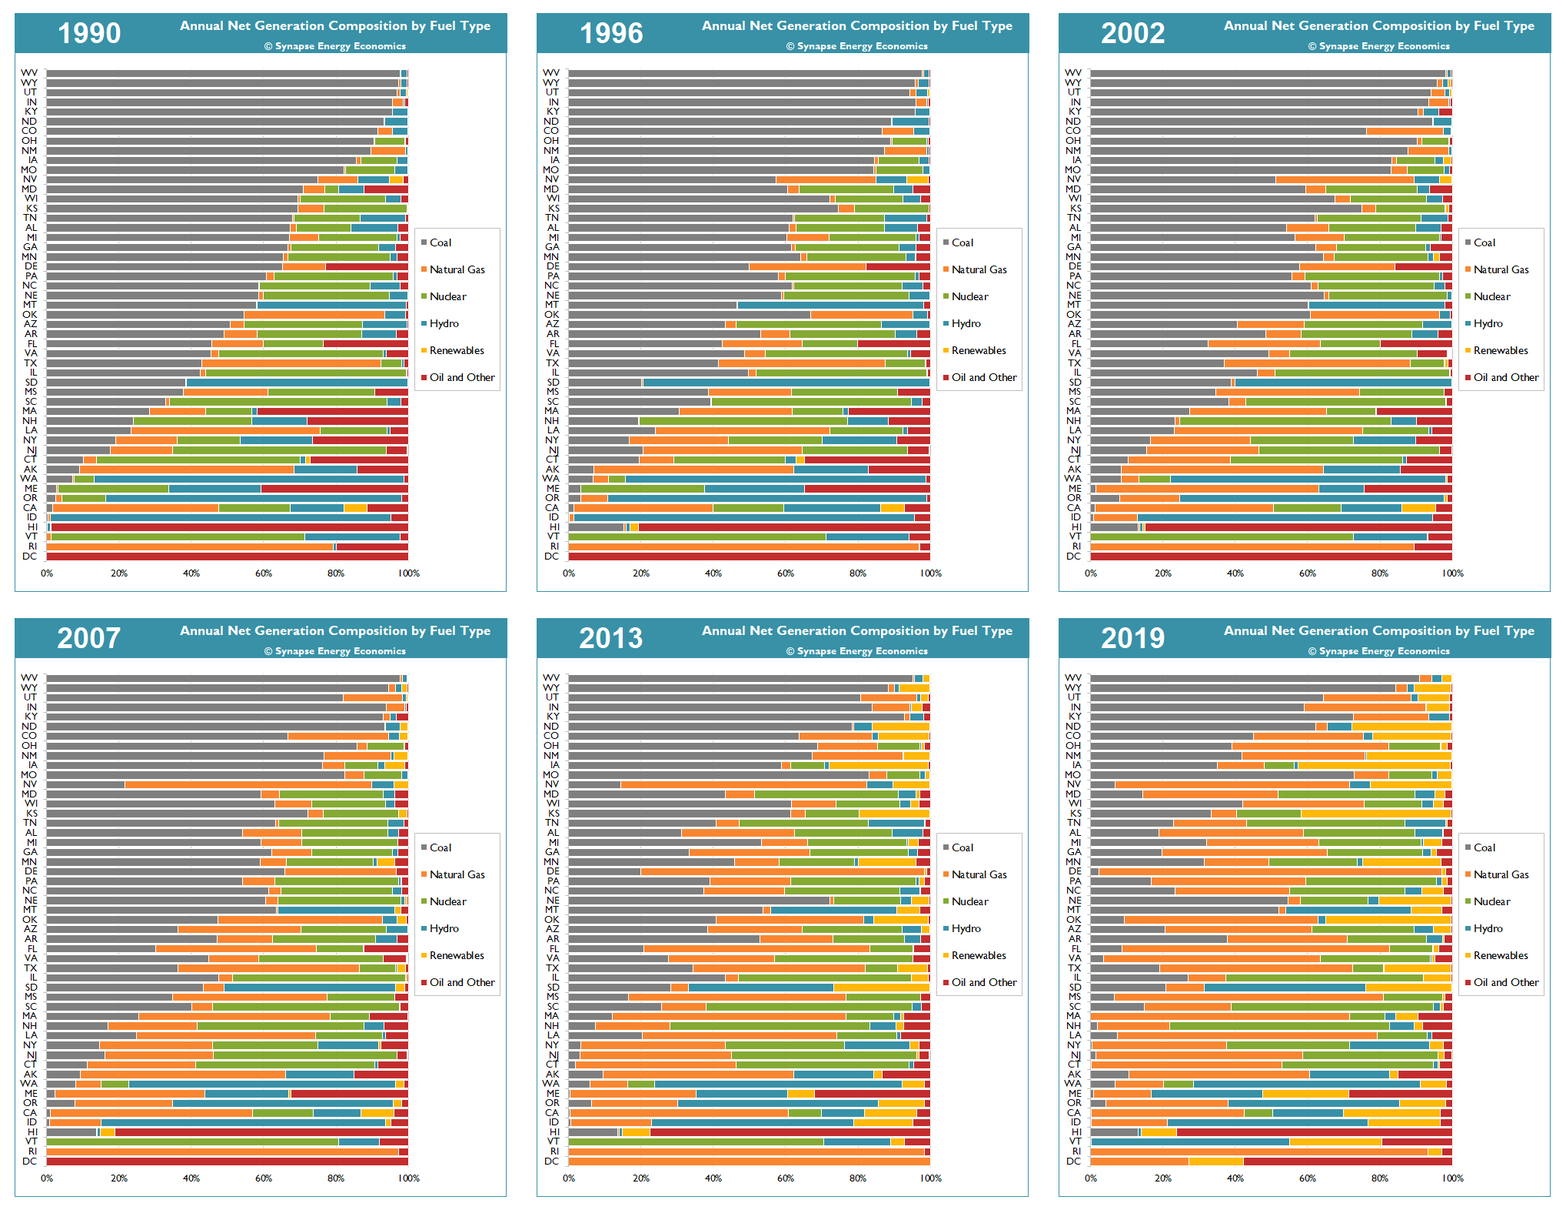
The animation in Figure 1 demonstrates how the resource mix of energy generated in each state has transformed between 1990 and 2019. Over time, the share of generation from coal has shrunk compared to that of natural gas and renewables (see Table 1). In 2019, 20 states produced 10 percent or less of their generation from coal, compared to 12 states in 2010, with nearly twice as many states producing less than 1 percent of their electricity from coal, relative to 10 years ago. In 2019, 18 states produced 10 percent or more generation from renewables, compared to just three states in 2010. And six states now produce more than one-quarter of their electricity from renewables.
Figure 1. Annual net generation composition by fuel type and state, 1990-2019

Note: In this figure, "Renewables" includes wind, solar, geothermal, and storage while "Oil and Other" includes oil, biomass, petcoke, solid waste, landfill gas, tires, purchases, and other miscellaneous fuel types. This figure only shows generation from utility-scale resources and does not include distributed generation (e.g., rooftop solar).
Sources: EIA Forms 923, 906, 920, 759, and 867, 1990-2019
Table 1. Number of states with low levels of coal or high levels of renewables